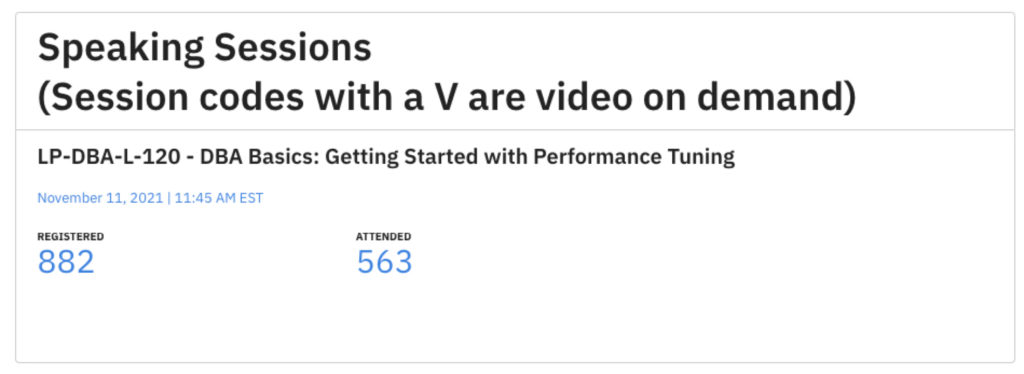
This past month I was honored to build and deliver a session that would help anyone get started with performance tuning. If you signed up for free to attend you can catch the session on-demand for free for six months.
How Did the Session Go?
This was one of my favorite sessions and it looks like it did get attended well.
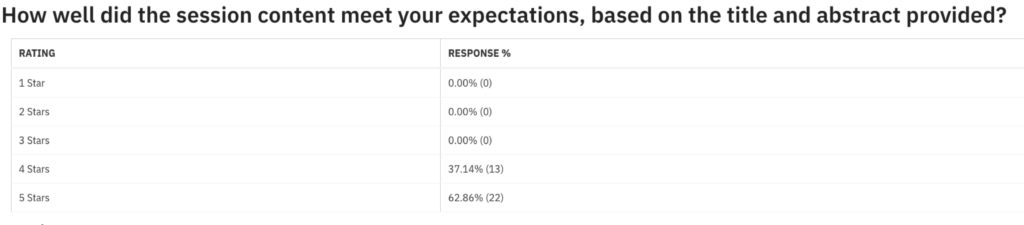
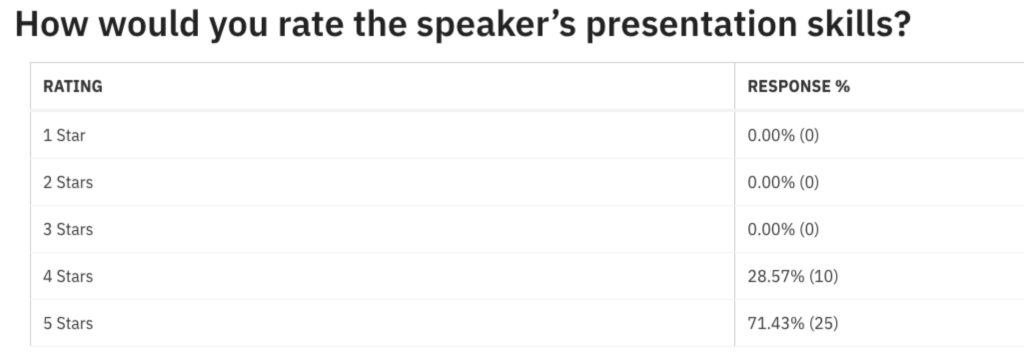
Speaker Survey Results
The following were the survey results from the virtual conference.
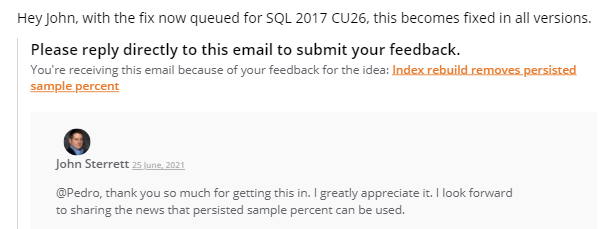
Hi Everyone, this is John Sterrett. I am a SQL Server Consultant in Austin, TX. Last year I blogged about a feature called Persist Sample Percent. It had a nasty bug that could negatively impact performance. I have great news to share. The fix is now rolled into SQL 2016 SP2 CU17 and SQL 2019 CU10. Pedro Lopes let me know that with the fix now queued for SQL 2017 CU26, this becomes fixed in all versions.
Breaking News… Persist Sample Percent is coming to SQL 2017 Soon!
Kudos to Pedro Lopes and the MSSQL Development team for this update. Make sure you are applying the latest updates so you can leverage all great enhancements, updates, and fixes.
Persist Sample Percent Matters
Okay, you might be wondering why should I consider utilizing persist sample percent? If you have large tables, auto update statistics might be hurting you instead of helping. Yup, that is not a typo. Also, if you update statistics and don’t provide a sample percent you can have the same problem. Worst case, you have a job that updates statistics with a good sample percent, data changes and auto-update uses a subpar percent.
By default, modern versions of SQL Server will utilize a smaller sample percent as your table row count grows. This can potentially give you bad execution plans.
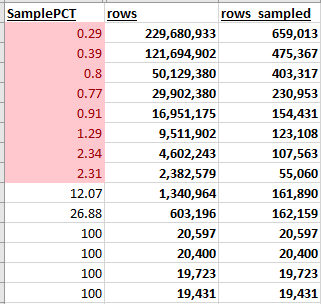
Let’s take a look at the example below. It doesn’t take a whole lot of rows to get a sample percent under 10%
If Puff Daddy was a DBA he would say, “More Rows More Problems..”
If you want to identify if this is a potential problem in your environment I am including the script below that we utilize in our SQL Server Health Check.
;with cte as (SELECT CAST(((rows_sampled * 1.00)/ [rows] )*100.00 AS NUMERIC(5,2)) AS SamplePCT, OBJECT_NAME(s.object_id) as TableNAME, s.name StatsName,
    sp.*
    FROM sys.stats AS s
    OUTER APPLY sys.dm_db_stats_properties (s.[object_id], s.stats_id) AS sp
	JOIN sys.objects o on s.object_id = o.object_id and o.is_ms_shipped = 0
    WHERE 1=1)
	select * from cte where SamplePCT IS NULL or SamplePCT < 10
	order by SamplePCT
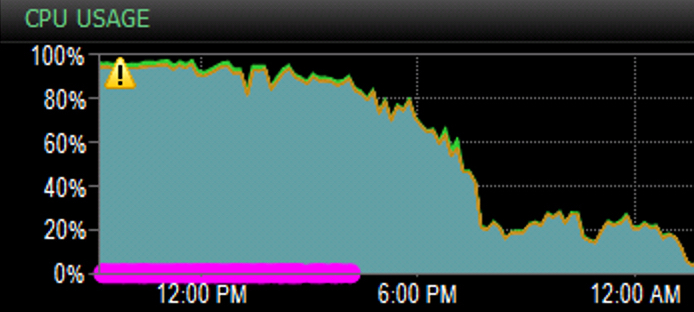
The following is an example of this occurring. The only change we made was updating stats with a fixed sample rate.
Does anyone want to guess when Stats was updated?
Persist Sample Percent Is Your Friend
You can utilize persist sample percent as long as you are utilizing one of the cumulative updates (CU’s) provided above or a newer CU. Persist sample percent will lock in your sample percent. You will no longer need to worry about an index rebuild removing the persisted sample percent which puts you back at the default sample percent.
When a bug jumps out and surprises me I like to share it so others do not run into the same unexpected result. I don’t think there is any reason for a bug to bite multiple people in the butt. Therefore, I want to show you why persist sample percent IS NOT PERSISTED!
Why should I use Persist Sample Percent?
When your table grows and the rows multiply the default statistics sample percent used by SQL Server gets smaller and smaller. In theory, persist sample percent lets you update your statistic once specifying the percent it should use going forward when a sample percent is not specified. Unfortunately, this feature is broken, IMHO.
Persist Sample Percent Setup
To set up the scene so you can reproduce and learn. Below we create a single-column table that is an identity and also primary key. Therefore, an index is created which also will create statistics on our column.
DROP TABLE dbo.Test
CREATE TABLE dbo.Test (ID INT IDENTITY NOT NULL CONSTRAINT TestPK PRIMARY KEY);

 INSERT INTO dbo.Test DEFAULT VALUES
 GO 10000000 --100 million rows..

	CREATE PROCEDURE dbo.DemoStatsReview
	AS BEGIN
	SELECT CAST(((rows_sampled * 1.00)/ [rows] )*100.00 AS NUMERIC(5,2)) AS SamplePCT,
	sp.*
	FROM sys.stats AS s
	OUTER APPLY sys.dm_db_stats_properties (s.[object_id], s.stats_id) AS sp
	WHERE s.[name] = N'TestPK';
	END
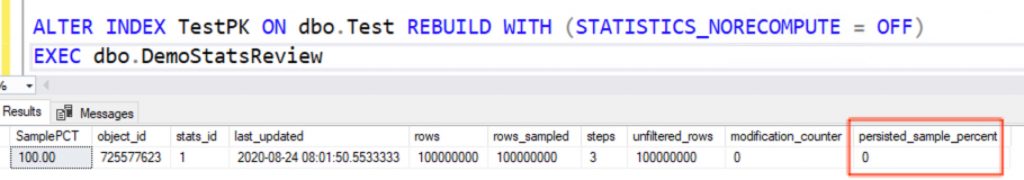
First, we will rebuild our index utilizing a fullscan. This is expected and normal activity for an index rebuild.
/* Index Rebuild uses 100% rows for sampling */
ALTER INDEX TestPK ON dbo.Test REBUILD WITH (STATISTICS_NORECOMPUTE = OFF)
EXEC dbo.DemoStatsReview
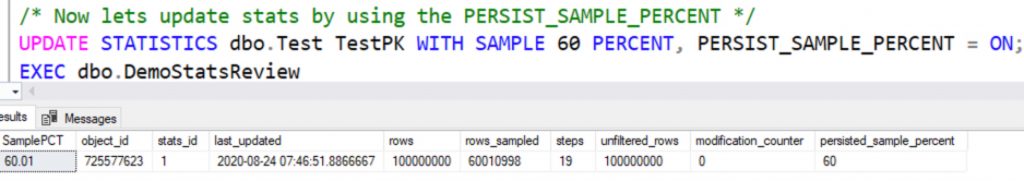
Now, we will update statistics utilizing the new Persist Sample Percent feature. This should give us two benefits. One, auto stats updates will use this sample rate going forward on this statistic. Two, we no longer need to supply an sample percent if we update statistics manually or with our maintenance jobs.
/* Now lets update stats by using the PERSIST_SAMPLE_PERCENT */
UPDATE STATISTICS dbo.Test TestPK WITH SAMPLE 60 PERCENT, PERSIST_SAMPLE_PERCENT = ON;
EXEC dbo.DemoStatsReview
We now have persisted sample percent to 60%. Now that we set it. We can forget it, right??
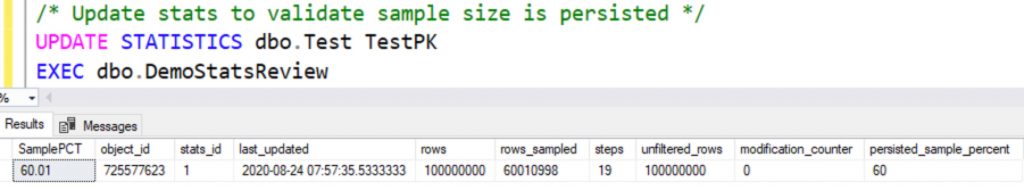
Let’s go ahead and update statistics now without any sample percent specified. We will see that the persist sample percent is applied as expected.
/* Update stats to validate sample size is persisted */
UPDATE STATISTICS dbo.Test TestPK
EXEC dbo.DemoStatsReview
Persist Sample Percent holds and the sample percent at 60%
Let’s see what happens when we rebuild the index. We expect that a FULLSCAN is used to update the statistics behind the index. Did anything else change? OH THE SUSPENSE!
/* What happens if we rebuild an index that has its stats persisted?
Do we still use 100% rows for sample? */

ALTER INDEX TestPK ON dbo.Test REBUILD WITH (STATISTICS_NORECOMPUTE = OFF)
EXEC dbo.DemoStatsReview
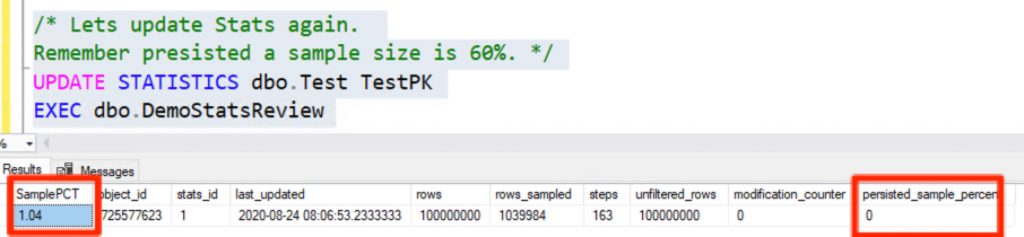
BOOM! Persisted Sample Percent is reset to ZERO on a Index Rebuild
/* Lets update Stats again.
Remember presisted a sample size is 60%. */
UPDATE STATISTICS dbo.Test TestPK
EXEC dbo.DemoStatsReview
We went from our desired 60% sample rate to 1%. This sample rate will only get lower as your data grows!
There you have it. The persist sample percent not only went away on the Index Rebuild but because we updated statistics without forcing a sample percent on 100 million rows the sample percent went to 1%. I will add another blog post that focuses on this later. For now, if the late Notorious BIG was a DBA he would say, “More rows,more problems with stats you get!” If this didn’t make any sense. The more row the lower there sample rate when statistics get updated.
How do we fix this?
This is a bug inside of SQL Server. There is a feedback item that hasn’t received any feedback from Microsoft in two years since the bug was reported. Please upvote so this can get the focus of Microsoft so persist sample percent is actually persisted!
UPDATE: 3/16/2020 The first script below was updated from setting QDS to “Read_Write” instead of “Read_Only”. Martin thank you for pointing this out in your comment below.
This month’s T-SQL Tuesday is hosted by Tracy Boggiano. Tracy invites us all to write about adopting Query Store. Today, I wanted to share my favorite but a very unique way I use the Query Store for Workload Replays.
You can read more about the invite in detail by clicking on the T-SQL Tuesday logo in this post.
Today, I wanted to talk about my least favorite part of replaying workloads. It’s having an extended event or server-side trace running during a workload replay only so we can compare the results at a query-level when the replay is finished. Now, this might seem like a trivial thing but when you have workloads over 10k batch requests/sec this can consume terabytes of data quickly. The worst part is waiting to read all the data, slice and dice the data for analysis.
Starting with SQL Server 2016 there is a better and faster way to go! You can replace your extended event or server-side trace with Query Store captured data. Today, I will show you how to use the Query Store for the same purpose.
Different Settings
Keep in mind our goal here is very different from the typical use case for using the Query Store. We want to capture metrics for all the queries executed during a workload replay. Nothing more and nothing less.
If we have the runtime results for multiple replays we can then easily compare the workload performance between the workload replays.
Most of our changes from the regular Query Store best practices are shown below:
Max Size (MB) – Need to make sure there is enough space to capture your whole workload. This size will vary by how much workload is being replayed.
Query Store Capture Mode set to All. Normally, not ideal, but remember we want to capture metrics for our whole workload being replayed.
Size Based Cleanup Mode set Off – Yup, we don’t want to lose our workload data that is capture until we persist in our ideal form. More on this later.
The Capture Process
Now, this is where you would use Database Experimentation Assistant (DEA), Distributed Replay or some other process to replay your consistent workload in an isolated non-production environment. This subject we will cover in another future post. For now, we will just have two replays called “Baseline” and “Change”. This simulates a baseline replay with no schema changes and then another change replay with a change introduced in the schema.
To capture our workload we just enable the Query store with our settings mentioned above and also clear out the query store right before our workload replay starts to help ensure we are just capturing our workload.
USE [master]
GO
ALTER DATABASE [YourDatabase] SET QUERY_STORE = ON
GO
ALTER DATABASE [YourDatabase]
SET QUERY_STORE (OPERATION_MODE = READ_WRITE,
 MAX_STORAGE_SIZE_MB = 10000,
 QUERY_CAPTURE_MODE = AUTO,
 SIZE_BASED_CLEANUP_MODE = OFF)
GO
ALTER DATABASE [YourDatabase] SET QUERY_STORE CLEAR
GO
Stop Capturing Query Store Data
Once your replay is finished we will want to disable the query store from writing data into the query store. We want the least amount of non-workload data inside of the Query Store when we are using it for the sole purpose of comparing workloads.
USE [master]
GO
ALTER DATABASE [YourDatabase]
SET QUERY_STORE (OPERATION_MODE = READ_ONLY)
GO
Prepare Query Store Data for Long-Term Analysis
Now for smaller workloads, one might be happy with utilizing DBCC CLONEDATABASE to have a schema-copy of their workload with Query Store data persisted. This is perfectly fine. With bigger workloads being captured I have noticed there are ways to improve the performance of query store when doing analysis of the query store data. For example, clustered columnstore indexes can be very helpful for performance and compacity. Therefore, I like to have a schema for each replay and import the data. The following is a quick example of setting up a schema for a “baseline” replay and a “change” replay.
CREATE DATABASE [DBA]
GO
use [DBA]
GO
CREATE SCHEMA Baseline;
GO
CREATE SCHEMA Compare;
GO
Next, we will import our captured data from our baseline replay that’s in our read-only query store database. I also like to have a baked-in aggregate of metrics for reads, writes, duration and CPU at the query level.
use [YourDatabase]
GO
/* Load Data */
SELECT * INTO DBA.Baseline.query_store_runtime_stats
FROM sys.query_store_runtime_stats;

SELECT * INTO DBA.Baseline.query_store_runtime_stats_interval
from sys.query_store_runtime_stats_interval;

select * INTO DBA.Baseline.query_store_plan
from sys.query_store_plan;

select * INTO DBA.Baseline.query_store_query
from sys.query_store_query;

select * INTO DBA.Baseline.query_store_query_text
from sys.query_store_query_text;
/* Addition for SQL 2017 */
select * INTO DBA.Baseline.query_store_wait_stats
 from sys.query_store_wait_stats

use [DBA]
GO

SELECT SUM(Count_executions) AS TotalExecutions,
SUM(Count_executions*avg_duration) AS TotalDuration,
SUM(Count_executions*avg_logical_io_reads) AS TotalReads,
SUM(Count_executions*avg_logical_io_writes) AS TotalWrites,
SUM(count_executions*avg_cpu_time) AS TotalCPU,
query_hash
INTO Baseline.QueryResults
FROM Baseline.query_store_runtime_stats rs
JOIN Baseline.query_store_plan p ON rs.plan_id = p.plan_id
JOIN Baseline.query_store_query q ON p.query_id = q.query_id
GROUP BY q.query_hash
Next, we would reset the database to our starting position and add our query store settings as mentioned above in this blog post and replay or workload again. This time, we would dump our data into the “change” schema
use [YourDatabase]
GO
/* Load Data */
SELECT * INTO DBA.Compare.query_store_runtime_stats
FROM sys.query_store_runtime_stats;

SELECT * INTO DBA.Compare.query_store_runtime_stats_interval
from sys.query_store_runtime_stats_interval;

select * INTO DBA.Compare.query_store_plan
from sys.query_store_plan;

select * INTO DBA.Compare.query_store_query
from sys.query_store_query;

select * INTO DBA.Compare.query_store_query_text
from sys.query_store_query_text;

select * INTO DBA.Compare.query_store_wait_stats
 from sys.query_store_wait_stats

use [DBA]
GO

SELECT SUM(Count_executions) AS TotalExecutions,
SUM(Count_executions*avg_duration) AS TotalDuration,
SUM(Count_executions*avg_logical_io_reads) AS TotalReads,
SUM(Count_executions*avg_logical_io_writes) AS TotalWrites,
SUM(count_executions*avg_cpu_time) AS TotalCPU,
query_hash
INTO Compare.QueryResults
FROM Compare.query_store_runtime_stats rs
JOIN Compare.query_store_plan p ON rs.plan_id = p.plan_id
JOIN Compare.query_store_query q ON p.query_id = q.query_id
GROUP BY q.query_hash
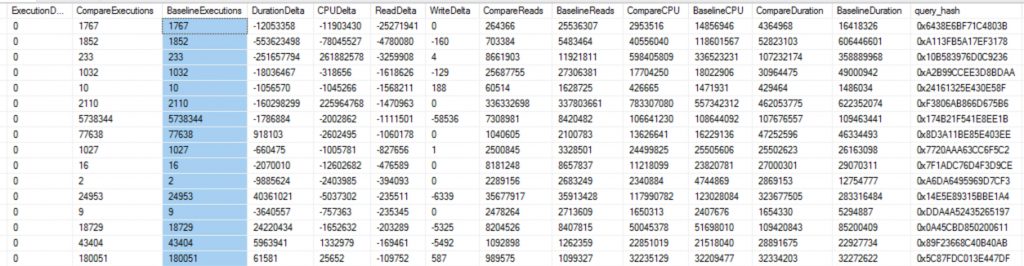
Comparing Workload Results
Now that we have our two workloads imported we can now compare to see how the workload changed per query. I will break this down into two quick steps. First, get deltas per query. Second, get totals for how many times a query might be different in the query store. More on this a little later in the post.
/* Query Store Results */
use [DBA]
GO

SELECT DISTINCT
c.TotalExecutions - b.TotalExecutions AS ExecutionDelta,
c.TotalExecutions AS CompareExecutions,
b.TotalExecutions AS BaselineExecutions,
c.TotalDuration - b.TotalDuration AS DurationDelta,
c.TotalCPU - b.TotalCPU AS CPUDelta,
c.TotalReads - b.TotalReads AS ReadDelta,
c.TotalWrites - b.TotalWrites AS WriteDelta,
c.TotalReads AS CompareReads,
b.TotalReads AS BaselineReads,
c.TotalCPU AS CompareCPU,
b.TotalCPU AS BaselineCPU,
c.TotalDuration AS CompareDuration,
b.TotalDuration AS BaselineDuration,
c.query_hash
--q.query_sql_text
INTO #CTE
FROM Baseline.QueryResults b
JOIN Compare.QueryResults c ON b.query_hash = c.query_hash


select COUNT(query_sql_text) AS QueryCount,
MAX(query_sql_text) query_sql_text,
MIN(query_id) MinQueryID,
qsq.query_hash
INTO #Compare
from Compare.query_store_query qsq
JOIN Compare.query_store_query_text q
	ON qsq.query_text_id = q.query_text_id
where qsq.is_internal_query = 0
GROUP BY query_hash

select COUNT(query_sql_text) AS QueryCount,
MAX(query_sql_text) query_sql_text,
MIN(query_id) MinQueryID,
qsq.query_hash
INTO #Baseline
from Baseline.query_store_query qsq
JOIN Baseline.query_store_query_text q
	ON qsq.query_text_id = q.query_text_id
where qsq.is_internal_query = 0
GROUP BY query_hash

select cte.*
, a.QueryCount AS Compare_QueryCount
, b.QueryCount AS Baseline_QueryCount
, a.MinQueryID AS Compare_MinQueryID
, b.MinQueryID AS Baseline_MinQueryID
, a.query_sql_text
FROM #CTE cte
JOIN #Compare a on cte.query_hash = a.query_hash
JOIN #Baseline b on cte.query_hash = b.query_hash
WHERE 1=1
AND ExecutionDelta = 0
ORDER BY ReadDelta ASC
Query Store for Workload Replays
Workload Replays compared down to the query execution level is priceless!
Lessons Learned Along the Way!
Initially, working with the query store I thought query_id was going to be my best friend. I quickly learned that my old friend query_hash is more helpful for multiple reasons. One, I can easily compare queries between different replays. That’s right now all workload replays get you the same query_id even when the workload is the exact same being replayed. Two, I can compare them with different databases as well. Finally, query_hash is very helpful with ad-hoc workloads as I can aggregate all the different query_ids that have the same query hash.
Microsoft made SQL Server 2019 Generally Available this week we want to share some videos and code examples of our favorite new features. Most of these will make your code go faster without any code changes!
We have been testing SQL Server 2019 for months and hope you enjoy these features as much as we do!
In SQL Server 2016 we saw Query Store. Query Store was a game changer to help database administrators identify troublesome queries. Query Store helps DBAs make those queries run faster. Microsoft’s marketing team even jumped on to help coin the phrase, “SQL Server It Just Runs Faster.” With SQL Server 2017, this started to get even better with automatic tuning. Don’t worry database administrators. Automatic Tuning will just enhance your career and not replace it.
SQL Server 2017 Automatic Tuning looks for queries where execution plans change and performance regresses. This feature depends on Query Store being enabled. Note, even if you don’t turn on Automatic Tuning you still get the benefits of having access to the data. That is right. Automatic Tuning would tell you what it would do if it was enabled. Think of this as free performance tuning training. Go look at the DMVs and try to understand why the optimizer would want to lock in an execution plan. We will actually go through a real-world example:
Automatic Tuning with SQL Server 2017
First, let’s take a quick look at the output of the data. You can find the query and results we will focus on below.
SELECT reason, score,
      script = JSON_VALUE(details, '$.implementationDetails.script'),
      planForceDetails.*,
      estimated_gain = (regressedPlanExecutionCount+recommendedPlanExecutionCount)
                  *(regressedPlanCpuTimeAverage-recommendedPlanCpuTimeAverage)/1000000,
      error_prone = IIF(regressedPlanErrorCount>recommendedPlanErrorCount, 'YES','NO')
--INTO DBA.Compare.Tunning_Recommendations
FROM sys.dm_db_tuning_recommendations
  CROSS APPLY OPENJSON (Details, '$.planForceDetails')
    WITH (  [query_id] int '$.queryId',
            [current plan_id] int '$.regressedPlanId',
            [recommended plan_id] int '$.recommendedPlanId',

            regressedPlanErrorCount int,
            recommendedPlanErrorCount int,

            regressedPlanExecutionCount int,
            regressedPlanCpuTimeAverage float,
            recommendedPlanExecutionCount int,
            recommendedPlanCpuTimeAverage float

          ) as planForceDetails;
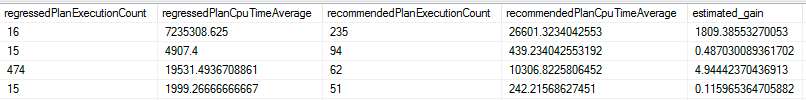
I will break the results down into two photos to make them fit well in this blog post.
Free Tuning Recommendations with SQL Server 2017 (1/2)
Free Tuning Recommendations with SQL Server 2017 (2/2)
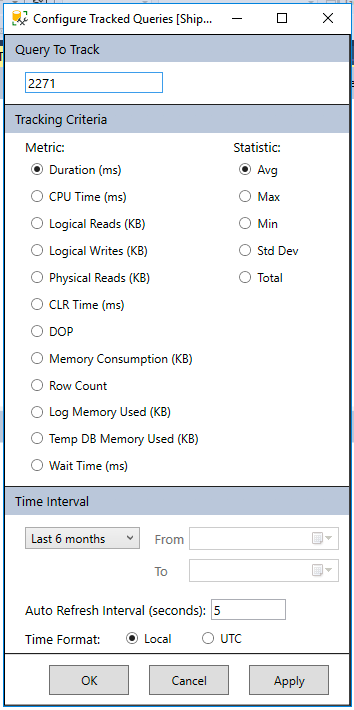
Now we know in the query store query_id 2271 has CPU time changing from 7,235ms to 26ms. That’s a big difference. Let’s take that query and look at its findings by using the tracked query report inside SSMS.
Find my Changed Query. Did the plans change?
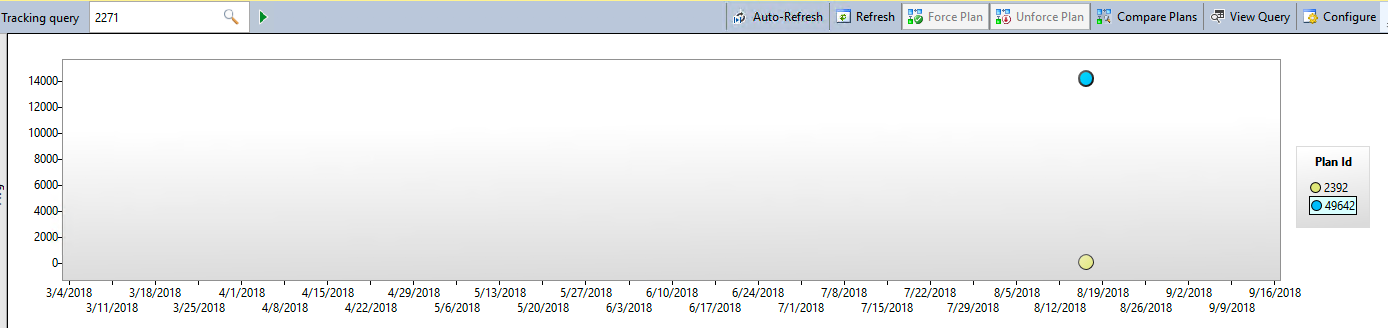
Here we can see the major difference between the two execution plans. One is averaging over 14 seconds in duration while the other is under a second.
Query Store showing the performance difference between the two plans
Now we can select both plans on the screen above and look at the execution plans side by side inside of SSMS. When doing so, we see the common example of the optimizer determining if it is better to scan an index vs a seek with a key lookup.
Using SSMS to compare auto tuning recommended query.
To complete the example I want to point out that automatic tuning would lock in the index seek plan (Plan 2392). In SQL Server 2016 you can do this as well manually inside Query Store. With SQL Server 2017 it can be done automatically for you with Automatic Tuning. If you have ever woken up to slow performance due to an execution plan changing and performance going through the drain this might be a life saver.
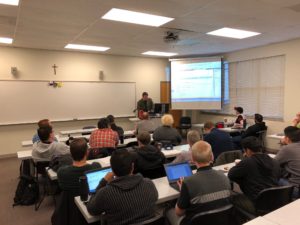
Last weekend I had a blast speaking at the SQL Saturday in Chicago. It was awesome to share my knowledge and also catch up with some good friends. My talk was on Automating the Pain Away with Query Store and Automated Tuning. I hope this session helped people leverage Query Store and Automated Tuning to resolve their parameter sniffing problems.
John Sterrett teaching Performance Tuning at SQL Saturday Chicago
This week at MVP Summit I got to talk with a friend who loves profiler. We were talking about capturing workloads and doing analysis on them. T-SQL or other 3rd party tools like ClearTrace, ReadTrace would be used to aggregate the data to get insight into the top offenders. I mentioned that workload analysis could be done with extended events without writing a single line of T-SQL. This was a lightbulb moment for him. Quickly, I learned that he is not alone and that there are a lot of people in the community who didn’t know this either.
I am including a quick video below to show you why Extended Events is a great solution for finding top offenders in a workload.
Have, you noticed an important query suddenly takes longer to run? Have you noticed the execution plan looks completely different than what you normally expect for your query? Today, I talked at the Performance Virtual Chapter going over how to identify plans that change and went over options to fix them in SQL Server 2005 to 2016 by forcing plans.
I would love to see Query Store have the ability to capture statistics for AG Secondaries that are enabled for read traffic. A bonus, would be the ability to force plans for AG Secondaries as well.
January 30th.SQLSaturday is a training event for SQL Server professionals and those wanting to learn about SQL Server. Admittance to this event is free ($15 for lunch), all costs are covered by donations and sponsorships. This all-day training event includes multiple tracks of SQL Server training from professional trainers, consultants, MCM’s, Microsoft Employees and MVPs.
Here are three reasons why I am excited to attend the SQL Saturday in Austin.
PreCons
While the SQL Saturday is free, there is also two separate all-day classes on Friday, January 29th that are dirt cheap compared to the cost of attending these classes at your local training center.
In Austin we are blessed to have some of the best teachers come to town to share their knowledge. We will have Connor Cunningham from the SQL Server Product team talk about the new features coming in SQL Server 2016. We will have several MVP’s and MCMs sharing their knowledge. If you want to learn about SQL Server there is not a better venue to do so than a local SQL Saturday.
Networking
Are you the only DBA or data professional working at your company? If not, are you interested in meeting people who are as passionate as you are about data? If so, SQL Saturday is a great place to meet and network with some of the best data professionals. I will never forget my first SQL Saturday. I found some vendors that had tools that made my job easier. I also built some friendships that have helped me thought out my career.
This site uses functional cookies and external scripts to improve your experience. Which cookies and scripts are used and how they impact your visit is specified on the left. You may change your settings at any time. Your choices will not impact your visit.
NOTE: These settings will only apply to the browser and device you are currently using.