With the release candidate of SQL Server 2025, which came out last week, I want to discuss a valuable feature you won’t see in the Microsoft press release: SQL Server 2025 Developer Standard Edition.
Microsoft is finally addressing a long-standing headache for database professionals. They finally included a Developer Standard edition in SQL Server 2025, fixing the mismatch between development and production environments. The new Standard Developer edition allows teams to build, test, and validate their database solutions using a free, fully licensed copy of the Standard edition for the first time!
SQL Server 2025 Developer Standard Edition eliminates costly licensing for non-production use while ensuring feature parity with production.
Previously, organizations used the Developer edition, functionally equivalent to the Enterprise edition, for development and testing. If you also used the enterprise edition in production, this wasn’t a problem. Problems occur when you try to save money using developer edition (enterprise edition) features in dev or test, while using the standard edition in production. This mismatch often led to surprises during deployment, such as features that worked in development but failed in production due to missing or restricted capabilities in the Standard edition. Or worse, code that works and returns the same results, but has abnormal performance because enterprise edition features cause a change in the execution plans.
For example, Intelligent Query Processing batch mode for row store—a feature only available in Enterprise and Developer editions—could not be used in Standard edition environments, leading to cases where performance can be good in development and testing with the same data and transactional load footprint as production, but give you worse performance in production when utilizing standard edition.
In the past, we would have to use the Developer edition, which opened this window for utilizing enterprise features in dev and test. With SQL Server 2025, you can select the Standard Developer edition or Enterprise Developer edition during the installation, ensuring your development environment mirrors production as closely as possible. This is especially valuable for teams whose production workloads run on the Standard edition.

With SQL Server performance, edition matters. Below is a chart showing that the majority of the performance-based features are Enterprise edition-only features. For two reasons, this article will focus on Online index rebuilds and batch mode for row store queries.

Error Example: Online Index Rebuilds
To illustrate the practical impact, consider the scenario where a developer tries to use the ALTER INDEX ... REBUILD WITH (ONLINE = ON) command. This command works flawlessly in a Developer (Enterprise) environment, allowing users to rebuild indexes without downtime. However, if the production environment is Standard, the same command will fail with an error, since online index rebuilds are not supported in the Standard edition.

While this is not too hard to catch in testing, you would be surprised how often it is missed.
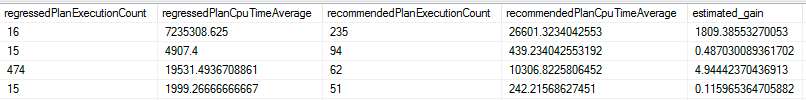
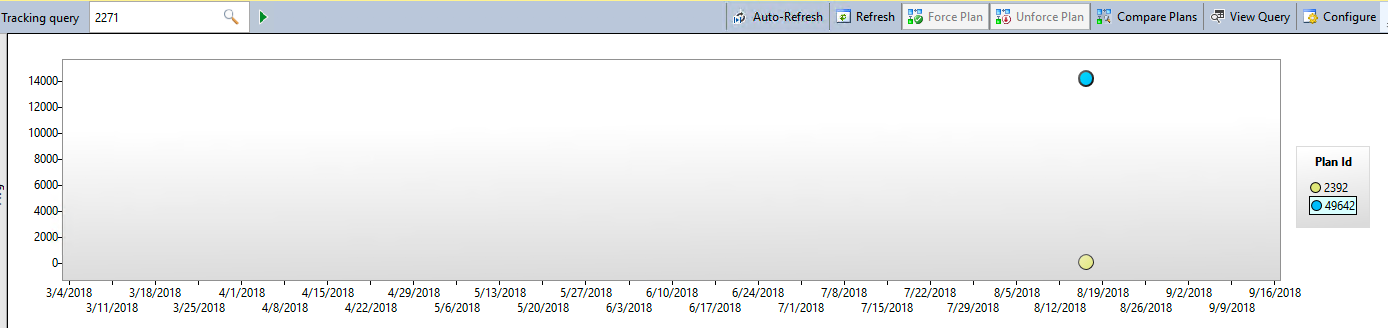
Let’s look at one more example that doesn’t cause an error but changes the performance and execution plans between the standard and enterprise editions. Because the developer edition before SQL Server 2025 used enterprise features, you would benefit from batch mode for your row store queries without knowing it.
SQL 2025 Standard Developer Edition: Different Plan and Performance
We will look at an example with the SQL Server Standard Developer Edition and the SQL Server Enterprise Developer Edition.
USE WideWorldImporters;
GO

SELECT
    ol.OrderID,
    ol.StockItemID,
    ol.Description,
    ol.OrderLineID,
    o.Comments,
    o.CustomerID
FROM
    Sales.OrderLines ol
INNER JOIN
    Sales.Orders o ON ol.OrderID = o.OrderID
WHERE
    ol.StockItemID = 168
GO
With the SQL Server Enterprise Developer Edition, we use an Adaptive Join to counteract filters with low and high numbers of rows.

With the SQL Server Standard Developer edition feature in SQL Server 2025, we see the same execution plan in dev, test, and production when we use the Standard edition for production. In this case, we don’t have batch mode, and you will see we use a hash join, which is not ideal for a small number of records for our filter.

The takeaway is that features can change functionality and how you get your data. This example would be more complex to catch in your development pipeline, most likely leading to a bad taste in your mouth about development and test being fast, but seeing negative performance when you release changes to production.
In summary, SQL Server 2025’s Standard Developer edition is a vital tool for any organization that values consistency and reliability across its database environments. Using the much more affordable standard edition of SQL Server empowers developers to test confidently, knowing that what works in development will also work in production—no more unpleasant feature surprises at go-live.
If you like our blog posts, subscribe to our newsletter . We will share all kinds of great stuff for FREE!