Tag Archives: Availability Group

Automatic Seeding Very Large Databases in SQL Server 2016

There are a lot of new features in SQL Server 2016. Availability Groups by itself got a lot of new features.  Being that I am the founder of the High Availability and Disaster Recovery Virtual Chapter, I plan on blogging about the new availability group features.

Today, I wanted to write about Automatic Seeding.  Microsoft did an excellent job of explaining how to enable and monitor automatic seeding.  I wanted to focus this post on my experience utilizing automatic seeding to seed an existing 600gb database in a test environment to test my endpoint network throughput.

The initial data synchronization easy button.

When you add a database to an availability group, the replicas must synchronize the data between the availability groups to join the database on the replicas.  In the past, data initialization has been done with mirroring, log shipping, backup, and restores.  Personally, I have been a big fan of log shipping for the initial data synchronization of VLDB’s especially when you need more than two replicas. Here is how I added a 60TB (Yes, TB not GB) database to an availability group that utilized multiple data centers.

Automatic seeding is a feature that has been in Azure SQL Databases for a while. It’s how the initial data synchronization occurs for Geo-Replication of Azure SQL Databases.  Automatic seeding utilizes a VDI Backup to take a copy only backup and send it over the endpoint network to seed the replicas and then join the databases with the replicas. This eliminates the need to manually take full and log backups from the primary replica to all the secondary replicas. It will also join the database on the replicas for you.

Bonus Feature of Automatic Seeding

There is also a bonus feature of automatic seeding for DBA’s and Information Technology professionals.  Even if you decide to not use automatic seeding I recommend testing this feature as automatic seeding can be a great way to stress your endpoint network to validate its throughput.

Background Information

This availability group has been configured with a separate 10Gbps network dedicated to endpoint traffic. Nothing else is active on the network or the replicas during the time of testing.

Setup

I configured the following performance monitor counters.

  • Bytes Received/sec on Secondary replicas
  • Bytes Sent/sec on Primary replica.

I also configured the following extended event session to monitor seeding activity on the primary and secondary replicas. We will focus on the “hadr_physical_seeding_progress” event today. We will talk about others in a future blog post.

CREATE EVENT SESSION [AlwaysOn_autoseed] ON SERVER 
ADD EVENT sqlserver.hadr_automatic_seeding_state_transition,
ADD EVENT sqlserver.hadr_automatic_seeding_timeout,
ADD EVENT sqlserver.hadr_db_manager_seeding_request_msg,
ADD EVENT sqlserver.hadr_physical_seeding_backup_state_change,
ADD EVENT sqlserver.hadr_physical_seeding_failure,
ADD EVENT sqlserver.hadr_physical_seeding_forwarder_state_change,
ADD EVENT sqlserver.hadr_physical_seeding_forwarder_target_state_change,
ADD EVENT sqlserver.hadr_physical_seeding_progress,
ADD EVENT sqlserver.hadr_physical_seeding_restore_state_change,
ADD EVENT sqlserver.hadr_physical_seeding_submit_callback
ADD TARGET package0.event_file(SET filename=N'autoseed.xel',max_file_size=(20),max_rollover_files=(4))
WITH (MAX_MEMORY=4096 KB,EVENT_RETENTION_MODE=ALLOW_SINGLE_EVENT_LOSS,
MAX_DISPATCH_LATENCY=30 SECONDS,MAX_EVENT_SIZE=0 KB,
MEMORY_PARTITION_MODE=NONE,TRACK_CAUSALITY=OFF,STARTUP_STATE=ON)
GO

The following T-SQL script is then used to read the results once your seeding process has completed. We will talk about the results in the results section below.

DECLARE @XFiles VARCHAR(300) = 'S:\MSSQL13.MSSQLSERVER\MSSQL\Log\autoseed*'

;WITH cXEvent
AS (
     SELECT    object_name AS event
              ,CONVERT(XML,event_data) AS  EventXml
     FROM      sys.fn_xe_file_target_read_file(@XFiles, NULL,NULL,NULL)
     where object_name like 'hadr_physical_seeding_progress')

 SELECT 
c1.value('(/event/@timestamp)[1]','datetime') AS time
,c1.value('(/event/@name)[1]','varchar(200)') AS XEventType
,c1.value('(/event/data[@name="database_id"]/value)[1]','int') AS database_id
,c1.value('(/event/data[@name="database_name"]/value)[1]','sysname') AS [database_name]
,c1.value('(/event/data[@name="transfer_rate_bytes_per_second"]/value)[1]','float') AS [transfer_rate_bytes_per_second]
,(c1.value('(/event/data[@name="transfer_rate_bytes_per_second"]/value)[1]','float')*8)/1000000.00 AS [transfer_Mbps]
,c1.value('(/event/data[@name="transferred_size_bytes"]/value)[1]','float') AS [transferred_size_bytes]
,c1.value('(/event/data[@name="database_size_bytes"]/value)[1]','float') AS [database_size_bytes]
,(c1.value('(/event/data[@name="transferred_size_bytes"]/value)[1]','float') / c1.value('(/event/data[@name="database_size_bytes"]/value)[1]','float'))*100.00 AS [PctCompleted]
,c1.value('(/event/data[@name="is_compression_enabled"]/value)[1]','varchar(200)') AS [is_compression_enabled]
,c1.value('(/event/data[@name="total_disk_io_wait_time_ms"]/value)[1]','bigint') AS [total_disk_io_wait_time_ms]
,c1.value('(/event/data[@name="total_network_wait_time_ms"]/value)[1]','int') AS [total_network_wait_time_ms]
,c1.value('(/event/data[@name="role_desc"]/value)[1]','varchar(300)') AS [role_desc]
,c1.value('(/event/data[@name="remote_machine_name"]/value)[1]','varchar(300)') AS [remote_machine_name]
,c1.value('(/event/data[@name="internal_state_desc"]/value)[1]','varchar(300)') AS [internal_state_desc]
,c1.value('(/event/data[@name="failure_code"]/value)[1]','int') AS [failure_code]
,c1.value('(/event/data[@name="failure_message"]/value)[1]','varchar(max)') AS [failure_message]

FROM cXEvent
    CROSS APPLY EventXml.nodes('//event') as t1(c1)

Results

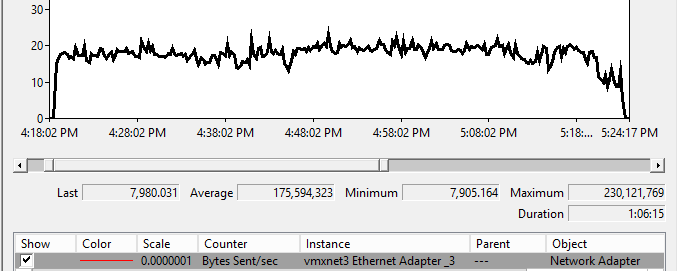
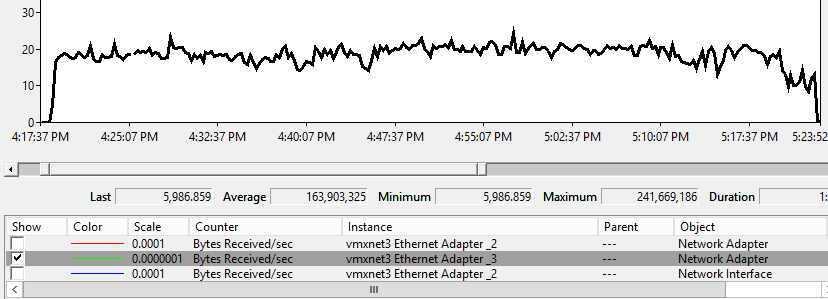
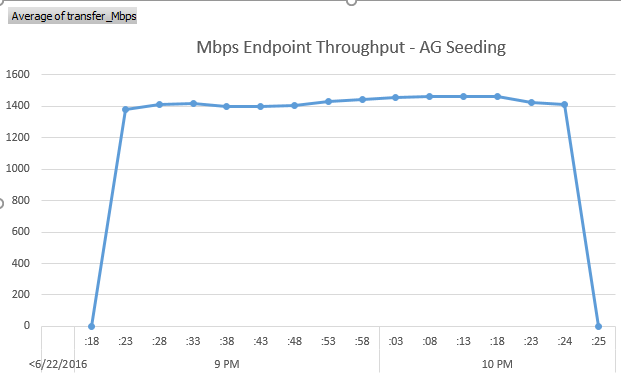
The 600 GB databases took about 66 minutes to seed across the network from a primary replica to the secondary replica.  I noticed 1.4 Gbps of consistent throughput during the seeding process. This makes a lot of sense as it caps out around what the storage system can deliver in this environment.

The first thing I would look at for benchmarking throughput for network activity would be the bytes sent per second from the primary replica and bytes received per second on the secondary replicas.

AG Seeding Primary Replica's Bytes Sent per Second

AG Seeding VLDB Primary Replica – Bytes Sent per Second

AG Seed VLDB Secondary Perfmon

AG Seed VLDB Secondary Replica – Bytes Received per Second

I am seeing average around 1.4 Gbps.  Normally, just looking at bytes sent and bytes received will be good enough for you to measure your throughput.  Especially, when nothing else is utilizing the dedicated endpoint network. In the field, I usually do not see dedicated networks for endpoint traffic so I wanted to take this a step further and monitor with some of the new extended event events for automatic seeding.

Here is a look at the raw data from the extended event capture showing the progress and throughput of the seeding.

AG Seed Xevent Transfer

The following is a nice excel graph showing the throughput in Mbps. I added an extra row with zero for throughput just to show the rise and fall of network usages as seeding starts and completes.
AG Seeding Excel Graph

My Thoughts

Initial data synchronization process just got a lot easier.  I will use this for sure for adding new databases to availability groups.  If you can live with your transactional log not being truncated during the seeding process I strongly encourage you to use automatic seeding.

I also did not use trace flag 9567  to enable compression during this test. It is why you saw compression not being enabled.  If you have the CPU resources I recommend you test this as well.

Reference Links

For more great information on SQL Server subscribe to my blog and follow me on twitter.

Photo Credit: Mike Mozart (Creative Commons)

Adding a VLDB database to an SQL Server Availability Group

Recently, I was tasked with making an 60TB database highly available by adding it to an availability group. The following, is how I successfully completed adding the very large database (VLDB) to an Availability Group that had two replicas in the primary data center and a third replica in another data center with no downtime. We wanted to utilize the least amount of time during the initial synchronization process so we leverage log shipping to prepare the database on each replica.

We will call the three servers DC1Server1, DC1Server2, and DC2Server3.  We will have a pre-created AG called SQL2014AG1. We will say that the 60TB database is named VLDB.

Previously we did a side by side upgrade to upgrade VLDB from running on SQL Server 2012 to SQL Server 2014 on new hardware.  Previously, we also leveraged the new hardware to upgrade a subset of the data and build out the Availability Group for testing and training purposes.

  1. Create Availability Group. This was created in advance to deliver a proof of concept and to provide training for understanding how to use and manage an Availability Group. Therefore, there was no reason to break this and recreate it. If needed, you could obviously create the AG as part of this deployment where we just Add the VLDB into the AG.  Creating an Availability Group will not be covered here.
  2. Configure Log Shipping. The primary database in log shipping should be on the instance that is also the read/write replica for the availability group. In this case, VLDB already exists and is configured as primary on DC1Server1. This is also the primary replica for the SQL2014AG1 availability group. If you need examples on how to configure log shipping checkout my article on MSSQLTips.com.
  3. Identify the Log Shipping backup Job. This job usually starts with LSBackup_ for your database. This will be on DC1Server1.
    1. Execute the SQL Agent Job to take a log transactional log backup
    2. Disable the SQL Agent Job when the backup completes.
  4. On the secondary servers (DC1Server2 and DC2Server3) identify the LSCopy_ job for your database named VLDB.
    1. Execute the SQL Agent Job to copy the last log backup that you just created in step three.
    2. Disable the SQL Agent Job when copy backup job completes.
  5. On the secondary servers (DC1Server2 and DC2Server3) identify the LSRestore_ job for your database named VLDB.
    1. Execute the SQL Agent Job to restore the backups pending to be restored. This should include your backup taken in Step four.
    2. Disable the SQL Agent Job when the restore completes.
  6. Validate that the last log backups were copied and restored. This can be done using sp_help_log_shipping_monitor stored procedure on each instance. We would do this on DC1Server1 to validate the last log backup that was completed. On DC1Server2 and DC2Server3 we can validate that the backup was copied and also restored.
  7. On the primary server DC1Server1 add the VLDB to the existing availability group named SQL2014AG1. You can do this via the GUI.
    1. In SSMS under Availability Groups expand “SQL2014AG1” Availability Group and right click on Availability Databases and select “Add Database” to add VLDB.
    2. Select the “VLDB” database in the checkbox
    3. Select Join Only to start data synchronization as we used Log shipping to keep the VLDB in sync across all servers.
    4. Connect to all existing secondary servers (DC1Server2, and DC2Server3)
    5. Validate adding the Database to the Availability Group
    6. Add the Availability Group to your Availability Group named SQL2014AG1
  8.  Validate that Adding VLDB was successful to SQL2014AG1
    1. Remove log shipping on DC1Server1 for the VLDB database.
    2. Enable your log backup process for all three servers. This would be used to replace log shipping for taking transactional log backups.


When will my replica be synchronized?

Recently, I was pulled into a gig to help troubleshoot an windows failover cluster service issue that was hindering an availability group. Just to give a little background information its a two node windows cluster with two replicas the availability groups are using synchronous mirroring. Once, this was resolved we had a critical database that was behind on synchronization because one of the two replicas (cluster node) was down. This lead to the following question. When will my replica by synchronized?

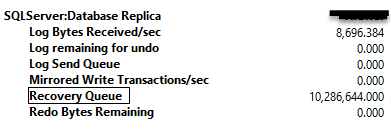
This question was easy to answer with database mirroring. We could pull up the database mirroring monitor. We don’t have an database replica monitor GUI tool built into SSMS. Lucky for us, its not that hard with availability groups. We just have to use performance monitor. You will see below there is an perfmon collection called “SQLServer:Database Replica” that comes in handy for us.

When will replica be synchronized?

When will replica be synchronized?

Above, you can see that this secondary replica which is back online is synchronizing as its receiving log bytes and the Recovery Queue shown in the performance monitor is also reducing as the synchronization process is catching up. According to MSDN Recovery Queue is the Amount of log records in the log files of the secondary replica that has not yet been redone.

Unplanned Availability Group Failover

Whenever a disaster occurs it will be a stressful scenario regardless of how small or big the disaster is. This gets multiplied when it is your first time working with a newer technology or the first time you are going through a disaster without a proper run book. Today, were going to help you establish a run book for creating a planned failover with availability groups.

A Step By Step Guide for Unplanned SQL Server Availability Group Failover can be found here.

Where is my Availability Group?

In SQL Server 2012 we got this great new high availability feature called availability groups. With readable secondaries under the covers it can be harder to figure out the following two questions. When did the availability group failover? Where did the availability group go when the failover occurred? The goal of this blog post is to help you answer these questions.

AlwaysON Extended Event

One of the things I really like about Availability Groups is that there is a built-in extended event named “ALwaysOn_health” that runs and captures troubleshooting information. I took a look at the extended event and noticed that there are several error numbers that were included in the filter for this extended event. This is shown below as I scripted out the default extended event for a quick review.

CREATE EVENT SESSION [AlwaysOn_health] ON SERVER 
ADD EVENT sqlserver.alwayson_ddl_executed,
ADD EVENT sqlserver.availability_group_lease_expired,
ADD EVENT sqlserver.availability_replica_automatic_failover_validation,
ADD EVENT sqlserver.availability_replica_manager_state_change,
ADD EVENT sqlserver.availability_replica_state_change,
ADD EVENT sqlserver.error_reported(
    WHERE ([error_number]=(9691) OR [error_number]=(35204) OR [error_number]=(9693) OR [error_number]=(26024) OR [error_number]=(28047) 
	OR [error_number]=(26023) OR [error_number]=(9692) OR [error_number]=(28034) OR [error_number]=(28036) OR [error_number]=(28048) 
	OR [error_number]=(28080) OR [error_number]=(28091) OR [error_number]=(26022) OR [error_number]=(9642) OR [error_number]=(35201) 
	OR [error_number]=(35202) OR [error_number]=(35206) OR [error_number]=(35207) OR [error_number]=(26069) OR [error_number]=(26070) 
	OR [error_number]>(41047) AND [error_number]<(41056) OR [error_number]=(41142) OR [error_number]=(41144) OR [error_number]=(1480) 
	OR [error_number]=(823) OR [error_number]=(824) OR [error_number]=(829) OR [error_number]=(35264) OR [error_number]=(35265))),
ADD EVENT sqlserver.lock_redo_blocked 
ADD TARGET package0.event_file(SET filename=N'AlwaysOn_health.xel',max_file_size=(5),max_rollover_files=(4))
WITH (MAX_MEMORY=4096 KB,EVENT_RETENTION_MODE=ALLOW_SINGLE_EVENT_LOSS,MAX_DISPATCH_LATENCY=30 SECONDS,MAX_EVENT_SIZE=0 KB,MEMORY_PARTITION_MODE=NONE,TRACK_CAUSALITY=OFF,STARTUP_STATE=ON)
GO

This got me interested in learning why these specific errors were included in the extended event session created specifically for managing Availability Groups. Knowing that the descriptions for errors are kept in the sys.messages table I did a little digging.

System Messages

Taking the error numbers from the AlwaysON_health extended event I was able to build the following query to get the description of the errors included in the extended event.

 SELECT * 
 FROM sys.messages m where language_id = 1033 -- English
 --AND m.message_id =1480
AND ([message_id]=(9691) OR [message_id]=(35204) OR [message_id]=(9693) OR [message_id]=(26024) OR [message_id]=(28047) 
	OR [message_id]=(26023) OR [message_id]=(9692) OR [message_id]=(28034) OR [message_id]=(28036) OR [message_id]=(28048) 
	OR [message_id]=(28080) OR [message_id]=(28091) OR [message_id]=(26022) OR [message_id]=(9642) OR [message_id]=(35201) 
	OR [message_id]=(35202) OR [message_id]=(35206) OR [message_id]=(35207) OR [message_id]=(26069) OR [message_id]=(26070) 
	OR [message_id]>(41047) AND [message_id]<(41056) OR [message_id]=(41142) OR [message_id]=(41144) OR [message_id]=(1480) 
	OR [message_id]=(823) OR [message_id]=(824) OR [message_id]=(829) OR [message_id]=(35264) OR [message_id]=(35265))
ORDER BY Message_id

Now we will focus on one particular error message. This is error message 1480. Looking at the description below you will see that every time a database included in an availability group or in database mirroring changes its role this error occurs.

The %S_MSG database “%.*ls” is changing roles from “%ls” to “%ls” because the mirroring session or availability group failed over due to %S_MSG. This is an informational message only. No user action is required.

When did my AlwaysOn Availability Group Failover?

By now it should not be a big surprise to see how you can figure out when our availability group failed over. To answer this question we are going to filter the “AwaysOn_health” extended event for error_number 1480.

The “AlwaysOn_health” extended event target is to file and by default it will utilize the default log folder for SQL Server. Also keep in mind, that by default the target does rollover for 4  5 MB files for a total of 20 MB. If you are constantly having events occur data will be purged.

For my server used for this blog post my path is “C:\Program Files\Microsoft SQL Server\MSSQL11.MSSQLSERVER\MSSQL\Log\” if this is not your path you will need to modify line 2 in the script below.

;WITH cte_HADR AS (SELECT object_name, CONVERT(XML, event_data) AS data
FROM sys.fn_xe_file_target_read_file('C:\Program Files\Microsoft SQL Server\MSSQL11.MSSQLSERVER\MSSQL\Log\AlwaysOn*.xel', null, null, null)
WHERE object_name = 'error_reported'
)

SELECT data.value('(/event/@timestamp)[1]','datetime') AS [timestamp],
	   data.value('(/event/data[@name=''error_number''])[1]','int') AS [error_number],
	   data.value('(/event/data[@name=''message''])[1]','varchar(max)') AS [message]
FROM cte_HADR
WHERE data.value('(/event/data[@name=''error_number''])[1]','int') = 1480

Below you will see an example of the result set which shows my last failover.

AGFailover


You could also utilize the Extended Event GUI to watch data. We will skip that today as I would recommend using T-SQL so you can find failovers in multiple Availability Groups on different servers. We will go into more detail about this process a little later in the blog post.

How Do We Become Proactive?

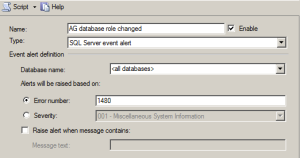
If you want an action to occur when an database inside an availability group changes roles to be proactive you can configure an SQL Agent Alert. An SQL Agent alert can performs an actions like sending an email to your DBA team or running another SQL Agent job to perform your required action.

The following shows you how to configure this alert via the SSMS user interface.

AGAlert


How Do We Report failovers across the Enterprise?

Central Management Server (CMS) is your best friend for building reports to show Availability Group failovers across the enterprise. You can build an CMS group for your SQL 2012 instances and copy and paste the query above to detect Availability Group failovers.

NOTE: This assumes you have an standard install process that keeps the default log path the same across your SQL Server 2012 instances. I strongly encourage that you have an automated SQL Install process that keeps using the same path for all your installs but we will keep that blog post for another day.