Category Archives: SQLServerPedia Syndication

This category is for SQLServerPedia Syndication

Learn High Availability and Disaster Recovery with SQL Server in a Day!

If you are near Pittsburgh, PA on May 22, 2014 catch the following all-day training session from 8:30 AM to 4:00 PM (EDT) 

Do you need to build a High Availability (HA) and/or Disaster Recovery (DR) strategy for SQL Server Databases? If so, you will no doubt have questions like:

•    What does a good High Availability or Disaster Recovery strategy look like?
•    What options are available to help implement a proper HA/DR strategy?
•    What do I do if my database server goes down?
•    How do I mitigate downtime for planned outages?
•    How much time do I have to recover, and which native SQL Server features helps me reach my goal?
•    How does this work with my company’s existing HA/DR strategy?

Linchpin People & SIOS are offering this seminar to answer those questions and more!
In this all-day training, we will help teach you the fundamentals and best practices of building and implementing a full HA/DR Strategy for your company.  You will learn how to build a recovery plan by mastering the basics of backups and restores. You will also learn how to implement and monitor log shipping, database mirroring, replication, Windows clustering, SQL Server Failover Clustering Instances, and the new Availability Group features. After this training session, you will have the knowledge to design, implement and manage your very own high availability and disaster recovery (HA/DR) plan.

Meet The Presenters!

High Availability and Disaster Recovery Cheap TrainingJohn Sterrett is a Group Principal and Sr. Consultant at Linchpin People. Previously, he was a Sr. Database Admin Advisor for Dell, directly responsible for several mission-critical databases behind dell.com. John has presented at many community events, is a PASS Regional Mentor, and one of the founders of the WVPASS user group and the PASS HA/DR Virtual Chapter. Tim RadneyTim Radney is the Lead System DBA for a top 40 US held bank. He is also a chapter leader for the Columbus GA SQL Users Group, PASS Regional Mentor for Greater South East US. Tim is a Microsoft Systems Admin turned DBA. Prior to becoming a full time DBA, he spent 10 years supporting Citrix, Novell, Windows, IIS, and MSSQL.

 Event Details:

Thursday May 22nd, 2014 – 8:30am-4:30pm (EDT)
Cost:  $79.00 before April 30th, $99.00 after April 30th
Location:
Microsoft Office
30 Isabella St., Second Floor
Alcoa Business Services Center
Pittsburgh, PA 15212
Phone: (412) 323-6700
Food:  Lunch, and drinks will be provided at the event location.  Please contact the organizer if you require a vegetarian option.

Where is my Availability Group?

In SQL Server 2012 we got this great new high availability feature called availability groups. With readable secondaries under the covers it can be harder to figure out the following two questions. When did the availability group failover? Where did the availability group go when the failover occurred? The goal of this blog post is to help you answer these questions.

AlwaysON Extended Event

One of the things I really like about Availability Groups is that there is a built-in extended event named “ALwaysOn_health” that runs and captures troubleshooting information. I took a look at the extended event and noticed that there are several error numbers that were included in the filter for this extended event. This is shown below as I scripted out the default extended event for a quick review.

CREATE EVENT SESSION [AlwaysOn_health] ON SERVER 
ADD EVENT sqlserver.alwayson_ddl_executed,
ADD EVENT sqlserver.availability_group_lease_expired,
ADD EVENT sqlserver.availability_replica_automatic_failover_validation,
ADD EVENT sqlserver.availability_replica_manager_state_change,
ADD EVENT sqlserver.availability_replica_state_change,
ADD EVENT sqlserver.error_reported(
    WHERE ([error_number]=(9691) OR [error_number]=(35204) OR [error_number]=(9693) OR [error_number]=(26024) OR [error_number]=(28047) 
	OR [error_number]=(26023) OR [error_number]=(9692) OR [error_number]=(28034) OR [error_number]=(28036) OR [error_number]=(28048) 
	OR [error_number]=(28080) OR [error_number]=(28091) OR [error_number]=(26022) OR [error_number]=(9642) OR [error_number]=(35201) 
	OR [error_number]=(35202) OR [error_number]=(35206) OR [error_number]=(35207) OR [error_number]=(26069) OR [error_number]=(26070) 
	OR [error_number]>(41047) AND [error_number]<(41056) OR [error_number]=(41142) OR [error_number]=(41144) OR [error_number]=(1480) 
	OR [error_number]=(823) OR [error_number]=(824) OR [error_number]=(829) OR [error_number]=(35264) OR [error_number]=(35265))),
ADD EVENT sqlserver.lock_redo_blocked 
ADD TARGET package0.event_file(SET filename=N'AlwaysOn_health.xel',max_file_size=(5),max_rollover_files=(4))
WITH (MAX_MEMORY=4096 KB,EVENT_RETENTION_MODE=ALLOW_SINGLE_EVENT_LOSS,MAX_DISPATCH_LATENCY=30 SECONDS,MAX_EVENT_SIZE=0 KB,MEMORY_PARTITION_MODE=NONE,TRACK_CAUSALITY=OFF,STARTUP_STATE=ON)
GO

This got me interested in learning why these specific errors were included in the extended event session created specifically for managing Availability Groups. Knowing that the descriptions for errors are kept in the sys.messages table I did a little digging.

System Messages

Taking the error numbers from the AlwaysON_health extended event I was able to build the following query to get the description of the errors included in the extended event.

 SELECT * 
 FROM sys.messages m where language_id = 1033 -- English
 --AND m.message_id =1480
AND ([message_id]=(9691) OR [message_id]=(35204) OR [message_id]=(9693) OR [message_id]=(26024) OR [message_id]=(28047) 
	OR [message_id]=(26023) OR [message_id]=(9692) OR [message_id]=(28034) OR [message_id]=(28036) OR [message_id]=(28048) 
	OR [message_id]=(28080) OR [message_id]=(28091) OR [message_id]=(26022) OR [message_id]=(9642) OR [message_id]=(35201) 
	OR [message_id]=(35202) OR [message_id]=(35206) OR [message_id]=(35207) OR [message_id]=(26069) OR [message_id]=(26070) 
	OR [message_id]>(41047) AND [message_id]<(41056) OR [message_id]=(41142) OR [message_id]=(41144) OR [message_id]=(1480) 
	OR [message_id]=(823) OR [message_id]=(824) OR [message_id]=(829) OR [message_id]=(35264) OR [message_id]=(35265))
ORDER BY Message_id

Now we will focus on one particular error message. This is error message 1480. Looking at the description below you will see that every time a database included in an availability group or in database mirroring changes its role this error occurs.

The %S_MSG database “%.*ls” is changing roles from “%ls” to “%ls” because the mirroring session or availability group failed over due to %S_MSG. This is an informational message only. No user action is required.

When did my AlwaysOn Availability Group Failover?

By now it should not be a big surprise to see how you can figure out when our availability group failed over. To answer this question we are going to filter the “AwaysOn_health” extended event for error_number 1480.

The “AlwaysOn_health” extended event target is to file and by default it will utilize the default log folder for SQL Server. Also keep in mind, that by default the target does rollover for 4  5 MB files for a total of 20 MB. If you are constantly having events occur data will be purged.

For my server used for this blog post my path is “C:\Program Files\Microsoft SQL Server\MSSQL11.MSSQLSERVER\MSSQL\Log\” if this is not your path you will need to modify line 2 in the script below.

;WITH cte_HADR AS (SELECT object_name, CONVERT(XML, event_data) AS data
FROM sys.fn_xe_file_target_read_file('C:\Program Files\Microsoft SQL Server\MSSQL11.MSSQLSERVER\MSSQL\Log\AlwaysOn*.xel', null, null, null)
WHERE object_name = 'error_reported'
)

SELECT data.value('(/event/@timestamp)[1]','datetime') AS [timestamp],
	   data.value('(/event/data[@name=''error_number''])[1]','int') AS [error_number],
	   data.value('(/event/data[@name=''message''])[1]','varchar(max)') AS [message]
FROM cte_HADR
WHERE data.value('(/event/data[@name=''error_number''])[1]','int') = 1480

Below you will see an example of the result set which shows my last failover.

AGFailover


You could also utilize the Extended Event GUI to watch data. We will skip that today as I would recommend using T-SQL so you can find failovers in multiple Availability Groups on different servers. We will go into more detail about this process a little later in the blog post.

How Do We Become Proactive?

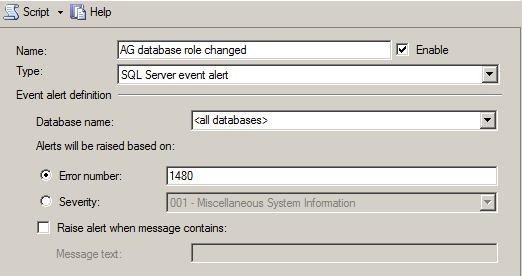
If you want an action to occur when an database inside an availability group changes roles to be proactive you can configure an SQL Agent Alert. An SQL Agent alert can performs an actions like sending an email to your DBA team or running another SQL Agent job to perform your required action.

The following shows you how to configure this alert via the SSMS user interface.

AGAlert


How Do We Report failovers across the Enterprise?

Central Management Server (CMS) is your best friend for building reports to show Availability Group failovers across the enterprise. You can build an CMS group for your SQL 2012 instances and copy and paste the query above to detect Availability Group failovers.

NOTE: This assumes you have an standard install process that keeps the default log path the same across your SQL Server 2012 instances. I strongly encourage that you have an automated SQL Install process that keeps using the same path for all your installs but we will keep that blog post for another day.

T-SQL Tuesday #50: Automation for LazyDBAs!

T-SQL Tuesday is a monthly blog party hosted by a different blogger each month.

T-SQL Tuesday 50 - Automation

T-SQL Tuesday 50 – Automation

This blog party was started by Adam Machanic (blog|twitter). You can take part by posting your own participating post that fits the topic of the month. This month, SQLChow blessed us with a topic I am very passionate about. This months T-SQL Tuesday topic is automation.

I have a confession to share. I am a Lazy DBA. Those who know me won’t be shocked by reading this. Those who don’t know me. Trust me, I mean this in a good way.  My lazyness over the years has actually motivated me to be a better DBA and data professional.  I learned early on in my career that in order to be productive I must automate. No longer can we do manual daily checklists. We lose several hours that could have been spent on tasks that show our value not just hold the status quo. Automation allows us to end the cycle of repeating tasks and allows me to spend that time doing things that provide value, save the company money and make us happy.

Early Stages of Automation

Once in my career I was blessed with an opportunity to be a Database Administrator overseeing thousands of production databases. Quickly, I noticed there was no automated process for a daily checklist.  How did we know if a database backup failed due to low disk space? Hopefully, we got an email from the SQL Agent. Hopefully, someone remembered to setup an SQL Agent notification. I knew this wasn’t the answer. One of my first tasks was automating this whole process so we knew which databases passed and failed an automated daily checklist. I was able to leverage Policy Based Management (PBM) and Central Management Server (CMS) with Powershell to get this done. Little did I know it at the time, but this basic move changed my DBA Career. I got to speak at the PASS Summit in 2011 on how I evaluated my automated daily checklist against 1000+ servers during my morning coffee break. Starting to focus on performance I noticed a better way to pull this information without PBM. I build an automated framework using Powershell and CMS to automate the process to get my failed backups quicker. Still today meet DBA’s today who didn’t know you can automate your daily checklist only using native tools built into SQL Server.

Current Stages of Automation

Today, I am much more focused on performance and proactive monitoring. Learning from my past I knew I wanted to automate as much as possible. This didn’t change even though my core skills were changing.  In the past year I built some nice automated solutions that help me with performance tuning.  When I am in charge of a new instance I automate the process of monitor disk latency, proactively automate the process to monitor wait statistics. Once I have a good automated baseline I can drill deeper as needed. For example, I can find out which queries are causing my waits. It has gotten me to the point where most of the time I can find the root cause to SQL Server performance problems in ten minutes. The automated benchmark process does the heavy lifting for me so I can respond and stay as proactive as possible and provide value instead of running processes that should be automated.

 Future State of Automation

I see more things being automated.  More and more parts of the current “Production DBA” role as we know it today will be automated. This is going to open us up to doing amazing things. One day, an end to end performance tuning process will be automated.  I look forward to seeing things that we thought were not possible be possible and automated. For example, automating server procurement and deployment once fell into this realm. Now, it’s already here. It’s known as “the cloud”. I will be honest, I was shocked to see how easy and quick it is to deploy an Windows Azure Server.

What are your thoughts about automation? Where do you see it going in the future?

Throwback Thursday #3: SQL Server & Disks

I hope everyone is having a good time gearing up for the holidays.   Throwback Thursday is a bi-weekly blog series where I dig deep into my evernote collection and find some great content on a single subject and share it with you.  In the third installment of the Throwback Thursday series we are going to cover some helpful SQL Server disk articles.

IOPS Calculator – This is a great tool to figure out how many IOPS you should get from your storage configuration. It’s also a helpful tool for estimating how many disks are needed to support your workload if you are purchasing new storage.

The Fundamental of Storage Systems – We couldn’t talk about storage and SQL Server without mentioning my friend Wes Brown. He has a plethora of information on this subject including this is a great blog series that hits all the basics.

Storage Top 10 Best Practices – A great quick list of best practices for storage with SQL Server provide by Microsoft. Over time, I have seen all of these best practices be neglected. I neglected a few myself when I was starting out and I paid for it.

Benchmark SQL Server Disk Latency – The following is how I benchmark disk latency with SQL Server. Remember this is just for SQL Server so you also want to take a look at perfmon too to verify if SQL Server is the cause to your I/O problems.

Measuring Disk Latency with Windows Performance Monitor –  Perfmon (Windows Performance Monitor) is the gold standard for measuring disk performance inside of windows. Have you ever wondered what exactly is included in the stack when you look at Avg Disk reads/sec? Jeff Huges does a great job of answering this question and some others you might not be thinking about.

Analyzing I/O Characteristics and Sizing Storage Systems for SQL Server Database Applications – This white paper by Microsoft is a great guide for sizing your I/O characteristics.  Its a great reference guide to use to understand how to not only benchmark I/O but also understand how to understand how SQL does I/O and also how to size your storage structure correctly.

How It Works: Bob Dorr’s SQL Server I/O Presentation – Want to know how I/O works in SQL Server? This is article on CSS SQL Engineers blog by Bob Dorr is your best starting point. It also has tons of links for great additional reading on how SQL Server works with disks. For example, Bob’s write up on SQL 2000 I/O basics is still relevant today.


Throwback Thursday #2: Get Your Speak On!

I hope everyone is having a great Thanksgiving with their families. When you come out of that food coma I hope you enjoy my second blog post in the Throwback Thursday series. Throwback Thursday is a bi-weekly blog series where I dig deep into my evernote collection and find some great content on a single subject and share it with you.

This week were going to cover becoming a speaker and becoming a better speaker. I am still working on several tips included in these links. 

The 30 skills every IT person should have – Questioning if public speaking is helpful for you IT career? Infoworld lists three skills involved with giving presentations in the top five of its list of skills everyone should have.

Presenting Opens Doors Kendal Van Dyke shares a great story on how presenting helped change his life. This is stuff you wont see on an ROI report.

You Don’t Have to Be an Expert To Speak – One of the first fears I had when I considered building presentations was that I wasn’t an expert.  After doing some thinking I decided to write why I  got up and present regardless of my experience.

Public Speaking: A Primer & Getting started in speaking publicly – clear and concise presentations – Paul Randal shared his thoughts on things you should think about as your working on that first presentation. His wife Kimberly Tripp also wrote a response post with some more goodies.  I forward these around quite a bit when I get asked, “How do you start speaking?”

51 Questions About Your #SQLPASS Summit Submission – Getting an abstract selected can be tough. Today, I still need all the help I can get drafting an abstract. I strongly recommend looking at this checklist. It  has a bunch of items you didn’t think about before you hit submit. Brent Ozar did a great job with this. If you like it check out his presentation links.

How To Successfully Deliver Presentations for Community Leaders and Professional SpeakersDan Stolts shares some great objectives that you should focus on when you start giving technical presentations. I am still working on some of these objectives.

Twenty Tips Better Conference Speaking – More awesome tips provided by Cameron Moll. I actually really enjoy the tip about managing expectations for your first presentation. We only get better through experience and you have to start somewhere.

Why You Should Create A Speakers Resume – If you have completed the hard task of building and giving a presentation make sure you get some credit. Kendra Little gives some great advice. At first I didn’t do this. Once I started I found out it helped me get some great jobs and more speaking gigs.

T-SQL Tuesday #41 – Presenting and Loving It – Bob Pusateri had a great concept for a T-SQL Tuesday topic. Go straight to the comments. They include links to your peers in the community who shared their why they love presenting. I really like this one, that one, oh and also this one too.

SQL PASS Speaker Resources – That’s right folks, our favorite community actually has some great resources including tips on starting, tools to record and more..

I’m A SQL Server Rockstar Blogger!


SQL Server Rockstar Blogger

SQL Server Rockstar Blogger

I have a quick secret to share with my readers. Ever since I saw Tom Larock’s SQL Server Blogger rankings I have always wanted to be on that list. Today, that happened. To many it might seem like a small accomplishment towards bigger accomplishments. Right now, I am just happy take a moment and realize I accomplished something I didn’t think was possible when I stared blogging.

When I started blogging my goals were simple. I wanted to improve my communication skills, document lessons learned so I could find them and share knowledge.  In reality, it has opened doors and given me opportunities I never thought would come my way.

Thanks Tom!

Throwback Thursday #1: SQL Inspire

What Is Throwback Thursday?

One of my hobbies is being a turntablist. In high school I took a job just so I could buy myself two Technics 1200’s, crates full of records and a mixer. I love scratching, beat juggling, and mixing accapella tracks over instrumentals. The radio stations I like would always have a turntablist  mix old school hits on Thursday. The show was called Throwback Thursdays.

Gregory Turnables

I am not the only turntablist in the family.

Being a database professional I learned to like backups. Backups didn’t just apply to database backups. I use evernote to backup blogs and articles that I found that are helpful for my career. Recently, this gave me a great idea to group them and share the ones that are old but still very valuable to my career. I am basically mixing some great content that you forgot about or never found that still applies as great reference material. If they are still helpful to me I bet they are helpful to others who frequently visit this blog.

#1 Throwback Topic: SQL Inspire

I had many different ideas for the first thursday throwback. I decided to go with my all-time favorite needle in the haystack. When I would go crate digging for a great instrumental to mix with a new hip hop song I would typically look for something that was unique and different.  When I think of conferences I found that with SQL Inspire. All presentations were recorded and they are still online. The concept is simple, try to inspire SQL people. Not only did Andy and Brian put on an event that inspired me, it also gave me my favorite SQL Server presentation of all-time. You can watch it below its only 20 minutes.

You can also catch the follow up interview. Tom’s prediction on the future of PASS two years ago is spot on. I think PASS accomplished some of those goals in just two years.

Here are all the SQL Inspire Presentations. I recommend that you watch them.


SQL Server Performance Root Cause Analysis in 10 Minutes

This year I was honored to be selected by Dell Software to present a ten minute session in their booth (#200) at the 2013 SQL PASS Member Summit. I decided to share how I do a SQL Server Performance Root Cause Analysis in 10 minutes with the SQL Community.

The following is my blog series and it includes all the sample code:

If you are attending the 2013 SQL PASS Member Summit lets connect. You can catch my presentation in the Dell Software Theater at Booth #200 at the times listed below.

Dates and Times:

  • Wednesday – October 16th @ 11:45am
  • Thursday – October 17th @ 1:45pm
  • Thursday – October 17th @ 3:15pm
  • Friday – October 18th @ 12:45pm

Finding Top Offenders From Cache

When I start a SQL Server Performance Root Cause Analysis I like to find the top waits and then find the queries causing the top waits. Next, I like to understand what is running and monitor disk latency. Finally, I would like to probe the cache to see what are my top offenders since the plans were cached.

** DOWNLOAD SCRIPTS **

Today, in this blog post were going to focus on the last remaining item, probing the cache to get top offenders. I do this because I would like to know if my current problem is also a long term problem. If you have stored procedures that get accessed frequently there is a good chance they will stay in cache. This allows you to take advantage of sys.dm_exec_query_stats to get aggregated information about cpu, reads, writes, duration for those plans. My favorite tw0 columns in sys.dm_exec_query_stats is query_hash and query_plan_hash.

QUERY_HASH and QUERY_PLAN_HASH

In the field I see a lot of people pulling data from sys.dm_exec_query_stats without grouping by query_hash and/or query_plan_hash. I strongly recommend you group by the hash columns because they can identify statements that are only different by literal values and statements with similar execution plans. For example, in the real world I have seen stored procedures with duplicate code.  Basically, someone did a copy and paste when they created the a new  stored procedure. Therefore, these stored procedures would have the same query_hash and query_plan_hash even thought the code belongs to different stored procedures.

How Many Executions?

Personally, I also want to know my top offenders for a few different cases. For example, if my top I/O statement only executed once it might not be as important as another statement that is the 3rd highest offender with I/O but executed 100,000 times.  Therefore, I added a parameter into my stored procedures so I can filter by execution count. This allows me to find my sweet spot for top offenders for a resource vs execution counts. I also added another parameter so I can filter how many statements are returned. This quickly allows me to do TOP 10 or TOP 5 or TOP 20 on the fly.

Now, lets take a look at the code.

Total I/O

/****** Object:  StoredProcedure [dbo].[GetTopStatements_TotalIO]    Script Date: 10/14/2013 10:16:35 AM ******/
SET ANSI_NULLS ON
GO

SET QUOTED_IDENTIFIER ON
GO

-- =============================================
-- Author:		John Sterrett (@JohnSterrett)
-- Create date: 6/4/2014
-- Description:	Gets Top IO statements based on execution count
-- Example: exec dbo.GetTopStatements_TotalIO @NumOfStatements = 5, @Executions = 100
-- =============================================
CREATE PROCEDURE [dbo].[GetTopStatements_TotalIO]
	-- Add the parameters for the stored procedure here
	@NumOfStatements int = 25,
	@Executions int = 5
AS
BEGIN
	-- SET NOCOUNT ON added to prevent extra result sets from
	-- interfering with SELECT statements.
	SET NOCOUNT ON;

    -- Insert statements for procedure here
	--- top 25 statements by IO
	IF OBJECT_ID('tempdb..#TopOffenders') IS NOT NULL
			DROP TABLE #TopOffenders
	IF OBJECT_ID('tempdb..#QueryText') IS NOT NULL
			DROP TABLE #QueryText
	CREATE TABLE #TopOffenders (AvgIO bigint, TotalIO bigint, TotalCPU bigint, AvgCPU bigint, TotalDuration bigint, AvgDuration bigint, [dbid] int, objectid bigint, execution_count bigint, query_hash varbinary(8))
	CREATE TABLE #QueryText (query_hash varbinary(8), query_text varchar(max))

	INSERT INTO #TopOffenders (AvgIO, TotalIO, TotalCPU, AvgCPU, TotalDuration, AvgDuration, [dbid], objectid, execution_count, query_hash)
	SELECT TOP (@NumOfStatements)
			SUM((qs.total_logical_reads + qs.total_logical_writes) /qs.execution_count) as [Avg IO],
			SUM((qs.total_logical_reads + qs.total_logical_writes)) AS [TotalIO],
			SUM(qs.total_worker_time) AS Total_Worker_Time,
			SUM((qs.total_worker_time) / qs.execution_count) AS [AvgCPU],
			SUM(qs.total_elapsed_time) AS TotalDuration,
			SUM((qs.total_elapsed_time)/ qs.execution_count) AS AvgDuration,
		qt.dbid,
		qt.objectid,
		SUM(qs.execution_count) AS Execution_Count,
		qs.query_hash
	FROM sys.dm_exec_query_stats qs
	cross apply sys.dm_exec_sql_text (qs.sql_handle) as qt
	GROUP BY qs.query_hash, qs.query_plan_hash, qt.dbid, qt.objectid
	HAVING SUM(qs.execution_count) > @Executions
	ORDER BY [TotalIO] DESC

--select * From #TopOffenders
--ORDER BY TotalIO desc

/* Create cursor to get query text */
DECLARE @QueryHash varbinary(8)

DECLARE QueryCursor CURSOR FAST_FORWARD FOR
select query_hash
FROM #TopOffenders

OPEN QueryCursor
FETCH NEXT FROM QueryCursor INTO @QueryHash

WHILE (@@FETCH_STATUS = 0)
BEGIN

		INSERT INTO #QueryText (query_text, query_hash)
		select MIN(substring (qt.text,qs.statement_start_offset/2, 
				 (case when qs.statement_end_offset = -1 
				then len(convert(nvarchar(max), qt.text)) * 2 
				else qs.statement_end_offset end -    qs.statement_start_offset)/2)) 
				as query_text, qs.query_hash
		from sys.dm_exec_query_stats qs
		cross apply sys.dm_exec_sql_text (qs.sql_handle) as qt
		where qs.query_hash = @QueryHash
		GROUP BY qs.query_hash;

		FETCH NEXT FROM QueryCursor INTO @QueryHash
   END
   CLOSE QueryCursor
   DEALLOCATE QueryCursor

		select distinct DB_NAME(dbid) DBName, OBJECT_NAME(objectid, dbid) ObjectName, qt.query_text, o.*
		INTO #Results
		from #TopOffenders o
		join #QueryText qt on (o.query_hash = qt.query_hash)

		SELECT TOP (@NumOfStatements) *
		FROM #Results
		ORDER BY TotalIO desc  

		DROP TABLE #Results
		DROP TABLE #TopOffenders
		DROP TABLE #QueryText
	END

GO

Total CPU

/****** Object:  StoredProcedure [dbo].[GetTopStatements_TotalCPU]    Script Date: 10/14/2013 10:21:32 AM ******/
SET ANSI_NULLS ON
GO

SET QUOTED_IDENTIFIER ON
GO

-- =============================================
-- Author:		John Sterrett (@JohnSterrett)
-- Create date: 6/4/2013
-- Description:	Gets statements causing most CPU from cache based on executions.
-- Example: exec dbo.GetTopStatements_TotalCPU @Executions = 5, @NumOfStatements = 25
-- =============================================
CREATE PROCEDURE [dbo].[GetTopStatements_TotalCPU]
	-- Add the parameters for the stored procedure here
	@NumOfStatements int = 25,
	@Executions int = 5
AS
BEGIN
	-- SET NOCOUNT ON added to prevent extra result sets from
	-- interfering with SELECT statements.
	SET NOCOUNT ON;

    -- Insert statements for procedure here
	--- top 25 statements by IO
IF OBJECT_ID('tempdb..#TopOffenders') IS NOT NULL
		DROP TABLE #TopOffenders
IF OBJECT_ID('tempdb..#QueryText') IS NOT NULL
		DROP TABLE #QueryText
CREATE TABLE #TopOffenders (AvgIO bigint, TotalIO bigint, TotalCPU bigint, AvgCPU bigint, TotalDuration bigint, AvgDuration bigint, [dbid] int, objectid bigint, execution_count bigint, query_hash varbinary(8))
CREATE TABLE #QueryText (query_hash varbinary(8), query_text varchar(max))

INSERT INTO #TopOffenders (AvgIO, TotalIO, TotalCPU, AvgCPU, TotalDuration, AvgDuration, [dbid], objectid, execution_count, query_hash)
SELECT TOP (@NumOfStatements)
        SUM((qs.total_logical_reads + qs.total_logical_writes) /qs.execution_count) as [Avg IO],
        SUM((qs.total_logical_reads + qs.total_logical_writes)) AS [TotalIO],
        SUM(qs.total_worker_time) AS [TotalCPU],
        SUM((qs.total_worker_time) / qs.execution_count) AS [AvgCPU],
        SUM(qs.total_elapsed_time) AS TotalDuration,
		SUM((qs.total_elapsed_time)/ qs.execution_count) AS AvgDuration,
    qt.dbid,
    qt.objectid,
    SUM(qs.execution_count) AS Execution_Count,
    qs.query_hash
FROM sys.dm_exec_query_stats qs
cross apply sys.dm_exec_sql_text (qs.sql_handle) as qt
GROUP BY qs.query_hash, qs.query_plan_hash, qt.dbid, qt.objectid
HAVING SUM(qs.execution_count) > @Executions
ORDER BY [TotalCPU] DESC

--select * From #TopOffenders
--ORDER BY TotalIO desc

/* Create cursor to get query text */
DECLARE @QueryHash varbinary(8)

DECLARE QueryCursor CURSOR FAST_FORWARD FOR
select query_hash
FROM #TopOffenders

OPEN QueryCursor
FETCH NEXT FROM QueryCursor INTO @QueryHash

WHILE (@@FETCH_STATUS = 0)
BEGIN

		INSERT INTO #QueryText (query_text, query_hash)
		select MIN(substring (qt.text,qs.statement_start_offset/2, 
				 (case when qs.statement_end_offset = -1 
				then len(convert(nvarchar(max), qt.text)) * 2 
				else qs.statement_end_offset end -    qs.statement_start_offset)/2)) 
				as query_text, qs.query_hash
		from sys.dm_exec_query_stats qs
		cross apply sys.dm_exec_sql_text (qs.sql_handle) as qt
		where qs.query_hash = @QueryHash
		GROUP BY qs.query_hash;

		FETCH NEXT FROM QueryCursor INTO @QueryHash
   END
   CLOSE QueryCursor
   DEALLOCATE QueryCursor

		select distinct DB_NAME(dbid) DBName, OBJECT_NAME(objectid, dbid) ObjectName, qt.query_text, o.*
		INTO #Results
		from #TopOffenders o
		join #QueryText qt on (o.query_hash = qt.query_hash)

		SELECT TOP (@NumOfStatements) *
		FROM #Results
		ORDER BY TotalCPU desc  

		DROP TABLE #Results
		DROP TABLE #TopOffenders
		DROP TABLE #QueryText
	END

GO

Total Duration

/****** Object:  StoredProcedure [dbo].[GetTopStatements_TotalDuration]    Script Date: 10/14/2013 10:18:49 AM ******/
SET ANSI_NULLS ON
GO

SET QUOTED_IDENTIFIER ON
GO

-- =============================================
-- Author:		John Sterrett (@JohnSterrett)
-- Create date: 6/4/2013
-- Description:	Get total duration from cache based on executions.
-- Example: exec dbo.GetTopStatements_TotalDuration @NumOfStatements = 25, @Executions = 5
-- =============================================
CREATE PROCEDURE [dbo].[GetTopStatements_TotalDuration]
	-- Add the parameters for the stored procedure here
	@NumOfStatements int = 25,
	@Executions int = 5
AS
BEGIN
	-- SET NOCOUNT ON added to prevent extra result sets from
	-- interfering with SELECT statements.
	SET NOCOUNT ON;

    -- Insert statements for procedure here
	--- top 25 statements by IO
IF OBJECT_ID('tempdb..#TopOffenders') IS NOT NULL
		DROP TABLE #TopOffenders
IF OBJECT_ID('tempdb..#QueryText') IS NOT NULL
		DROP TABLE #QueryText
CREATE TABLE #TopOffenders (AvgIO bigint, TotalIO bigint, TotalCPU bigint, AvgCPU bigint, TotalDuration bigint, AvgDuration bigint, [dbid] int, objectid bigint, execution_count bigint, query_hash varbinary(8))
CREATE TABLE #QueryText (query_hash varbinary(8), query_text varchar(max))

INSERT INTO #TopOffenders (AvgIO, TotalIO, TotalCPU, AvgCPU, TotalDuration, AvgDuration, [dbid], objectid, execution_count, query_hash)
SELECT TOP (@NumOfStatements)
        SUM((qs.total_logical_reads + qs.total_logical_writes) /qs.execution_count) as [Avg IO],
        SUM((qs.total_logical_reads + qs.total_logical_writes)) AS [TotalIO],
        SUM(qs.total_worker_time) AS Total_Worker_Time,
        SUM((qs.total_worker_time) / qs.execution_count) AS [AvgCPU],
        SUM(qs.total_elapsed_time) AS TotalDuration,
		SUM((qs.total_elapsed_time)/ qs.execution_count) AS AvgDuration,
    qt.dbid,
    qt.objectid,
    SUM(qs.execution_count) AS Execution_Count,
    qs.query_hash
FROM sys.dm_exec_query_stats qs
cross apply sys.dm_exec_sql_text (qs.sql_handle) as qt
GROUP BY qs.query_hash, qs.query_plan_hash, qt.dbid, qt.objectid
HAVING SUM(qs.execution_count) > @Executions
ORDER BY [TotalDuration] DESC

--select * From #TopOffenders
--ORDER BY TotalIO desc

/* Create cursor to get query text */
DECLARE @QueryHash varbinary(8)

DECLARE QueryCursor CURSOR FAST_FORWARD FOR
select query_hash
FROM #TopOffenders

OPEN QueryCursor
FETCH NEXT FROM QueryCursor INTO @QueryHash

WHILE (@@FETCH_STATUS = 0)
BEGIN

		INSERT INTO #QueryText (query_text, query_hash)
		select MIN(substring (qt.text,qs.statement_start_offset/2, 
				 (case when qs.statement_end_offset = -1 
				then len(convert(nvarchar(max), qt.text)) * 2 
				else qs.statement_end_offset end -    qs.statement_start_offset)/2)) 
				as query_text, qs.query_hash
		from sys.dm_exec_query_stats qs
		cross apply sys.dm_exec_sql_text (qs.sql_handle) as qt
		where qs.query_hash = @QueryHash
		GROUP BY qs.query_hash;

		FETCH NEXT FROM QueryCursor INTO @QueryHash
   END
   CLOSE QueryCursor
   DEALLOCATE QueryCursor

		select distinct DB_NAME(dbid) DBName, OBJECT_NAME(objectid, dbid) ObjectName, qt.query_text, o.*
		INTO #Results
		from #TopOffenders o
		join #QueryText qt on (o.query_hash = qt.query_hash)

		SELECT TOP (@NumOfStatements) *
		FROM #Results
		ORDER BY TotalDuration desc  

		DROP TABLE #Results
		DROP TABLE #TopOffenders
		DROP TABLE #QueryText
	END

GO

Average I/O

/****** Object:  StoredProcedure [dbo].[GetTopStatements_AvgIO]    Script Date: 10/14/2013 10:23:01 AM ******/
SET ANSI_NULLS ON
GO

SET QUOTED_IDENTIFIER ON
GO

-- =============================================
-- Author:		John Sterrett (@JohnSterrett)
-- Create date: 6/4/2013
-- Description:	Get statements from cache causing most average IO based on executions.
-- Example: exec dbo.GetTopStatements_AvgIO @Executions = 5, @NumOfStatements = 25
-- =============================================
CREATE PROCEDURE [dbo].[GetTopStatements_AvgIO]
	-- Add the parameters for the stored procedure here
	@NumOfStatements int = 25,
	@Executions int = 5
AS
BEGIN
	-- SET NOCOUNT ON added to prevent extra result sets from
	-- interfering with SELECT statements.
	SET NOCOUNT ON;

    -- Insert statements for procedure here
	IF OBJECT_ID('tempdb..#TopOffenders') IS NOT NULL
			DROP TABLE #TopOffenders
	IF OBJECT_ID('tempdb..#QueryText') IS NOT NULL
			DROP TABLE #QueryText
	CREATE TABLE #TopOffenders (AvgIO bigint, TotalIO bigint, TotalCPU bigint, AvgCPU bigint, TotalDuration bigint, AvgDuration bigint, [dbid] int, objectid bigint, execution_count bigint, query_hash varbinary(8))
	CREATE TABLE #QueryText (query_hash varbinary(8), query_text varchar(max))

	INSERT INTO #TopOffenders (AvgIO, TotalIO, TotalCPU, AvgCPU, TotalDuration, AvgDuration, [dbid], objectid, execution_count, query_hash)
	SELECT TOP (@NumOfStatements)
			SUM((qs.total_logical_reads + qs.total_logical_writes) /qs.execution_count) as [Avg IO],
			SUM((qs.total_logical_reads + qs.total_logical_writes)) AS [TotalIO],
			SUM(qs.total_worker_time) AS [TotalCPU],
			SUM((qs.total_worker_time) / qs.execution_count) AS [AvgCPU],
			SUM(qs.total_elapsed_time) AS TotalDuration,
			SUM((qs.total_elapsed_time)/ qs.execution_count) AS AvgDuration,
		qt.dbid,
		qt.objectid,
		SUM(qs.execution_count) AS Execution_Count,
		qs.query_hash
	FROM sys.dm_exec_query_stats qs
	cross apply sys.dm_exec_sql_text (qs.sql_handle) as qt
	GROUP BY qs.query_hash, qs.query_plan_hash, qt.dbid, qt.objectid
	HAVING SUM(qs.execution_count) > @Executions		
	ORDER BY [Avg IO] DESC

		--select * From #TopOffenders
		--ORDER BY AvgIO desc

		/* Create cursor to get query text */
		DECLARE @QueryHash varbinary(8)

		DECLARE QueryCursor CURSOR FAST_FORWARD FOR
		select query_hash
		FROM #TopOffenders

		OPEN QueryCursor
		FETCH NEXT FROM QueryCursor INTO @QueryHash

		WHILE (@@FETCH_STATUS = 0)
		BEGIN

				INSERT INTO #QueryText (query_text, query_hash)
				select MIN(substring (qt.text,qs.statement_start_offset/2, 
						 (case when qs.statement_end_offset = -1 
						then len(convert(nvarchar(max), qt.text)) * 2 
						else qs.statement_end_offset end -    qs.statement_start_offset)/2)) 
						as query_text, qs.query_hash
				from sys.dm_exec_query_stats qs
				cross apply sys.dm_exec_sql_text (qs.sql_handle) as qt
				where qs.query_hash = @QueryHash
				GROUP BY qs.query_hash;

				FETCH NEXT FROM QueryCursor INTO @QueryHash
		   END
		   CLOSE QueryCursor
		   DEALLOCATE QueryCursor

		select distinct DB_NAME(dbid) DBName, OBJECT_NAME(objectid, dbid) ObjectName, qt.query_text, o.*
		INTO #Results
		from #TopOffenders o
		join #QueryText qt on (o.query_hash = qt.query_hash)

		SELECT TOP (@NumOfStatements) *
		FROM #Results
		ORDER BY AvgIO desc  

		DROP TABLE #Results
		DROP TABLE #TopOffenders
		DROP TABLE #QueryText
	END

GO

Average CPU

/****** Object:  StoredProcedure [dbo].[GetTopStatements_AvgCPU]    Script Date: 10/14/2013 10:31:47 AM ******/
SET ANSI_NULLS ON
GO

SET QUOTED_IDENTIFIER ON
GO

-- =============================================
-- Author:		John Sterrett (@JohnSterrett)
-- Create date: 6/4/2013
-- Description:	Get Statements from cache that have highest average cpu utilization by executions
-- Example: exec dbo.GetTopStatements_AvgCPU @Executions = 5, @NumbOfStatements = 25
-- =============================================
CREATE PROCEDURE [dbo].[GetTopStatements_AvgCPU]
	-- Add the parameters for the stored procedure here
	@NumOfStatements int = 25,
	@Executions int = 5
AS
BEGIN
	-- SET NOCOUNT ON added to prevent extra result sets from
	-- interfering with SELECT statements.
	SET NOCOUNT ON;

    -- Insert statements for procedure here
	--- top 25 statements by IO
IF OBJECT_ID('tempdb..#TopOffenders') IS NOT NULL
		DROP TABLE #TopOffenders
IF OBJECT_ID('tempdb..#QueryText') IS NOT NULL
		DROP TABLE #QueryText
CREATE TABLE #TopOffenders (AvgIO bigint, TotalIO bigint, TotalCPU bigint, AvgCPU bigint, TotalDuration bigint, AvgDuration bigint, [dbid] int, objectid bigint, execution_count bigint, query_hash varbinary(8))
CREATE TABLE #QueryText (query_hash varbinary(8), query_text varchar(max))

INSERT INTO #TopOffenders (AvgIO, TotalIO, TotalCPU, AvgCPU, TotalDuration, AvgDuration, [dbid], objectid, execution_count, query_hash)
SELECT TOP (@NumOfStatements)
        SUM((qs.total_logical_reads + qs.total_logical_writes) /qs.execution_count) as [Avg IO],
        SUM((qs.total_logical_reads + qs.total_logical_writes)) AS [TotalIO],
        SUM(qs.total_worker_time) AS Total_Worker_Time,
        SUM((qs.total_worker_time) / qs.execution_count) AS [AvgCPU],
        SUM(qs.total_elapsed_time) AS TotalDuration,
		SUM((qs.total_elapsed_time)/ qs.execution_count) AS AvgDuration,
    qt.dbid,
    qt.objectid,
    SUM(qs.execution_count) AS Execution_Count,
    qs.query_hash
FROM sys.dm_exec_query_stats qs
cross apply sys.dm_exec_sql_text (qs.sql_handle) as qt
GROUP BY qs.query_hash, qs.query_plan_hash, qt.dbid, qt.objectid
HAVING SUM(qs.execution_count) > @Executions
ORDER BY [AvgCPU] DESC

--select * From #TopOffenders
--ORDER BY TotalIO desc

/* Create cursor to get query text */
DECLARE @QueryHash varbinary(8)

DECLARE QueryCursor CURSOR FAST_FORWARD FOR
select query_hash
FROM #TopOffenders

OPEN QueryCursor
FETCH NEXT FROM QueryCursor INTO @QueryHash

WHILE (@@FETCH_STATUS = 0)
BEGIN

		INSERT INTO #QueryText (query_text, query_hash)
		select MIN(substring (qt.text,qs.statement_start_offset/2, 
				 (case when qs.statement_end_offset = -1 
				then len(convert(nvarchar(max), qt.text)) * 2 
				else qs.statement_end_offset end -    qs.statement_start_offset)/2)) 
				as query_text, qs.query_hash
		from sys.dm_exec_query_stats qs
		cross apply sys.dm_exec_sql_text (qs.sql_handle) as qt
		where qs.query_hash = @QueryHash
		GROUP BY qs.query_hash;

		FETCH NEXT FROM QueryCursor INTO @QueryHash
   END
   CLOSE QueryCursor
   DEALLOCATE QueryCursor

		select distinct DB_NAME(dbid) DBName, OBJECT_NAME(objectid, dbid) ObjectName, qt.query_text, o.*
		INTO #Results
		from #TopOffenders o
		join #QueryText qt on (o.query_hash = qt.query_hash)

		SELECT TOP (@NumOfStatements) *
		FROM #Results
		ORDER BY AvgCPU desc  

		DROP TABLE #Results
		DROP TABLE #TopOffenders
		DROP TABLE #QueryText
	END

GO

Average Duration

/****** Object:  StoredProcedure [dbo].[GetTopStatements_AvgDuration]    Script Date: 10/14/2013 10:30:17 AM ******/
SET ANSI_NULLS ON
GO

SET QUOTED_IDENTIFIER ON
GO

-- =============================================
-- Author:		John Sterrett (@JohnSterrett)
-- Create date: 6/4/2013
-- Description:	Get statements from cache causing most average duration by executions
-- Example: exec dbo.GetTopStatements_AvgDuration @NumOfStatements = 25, @Executions = 5
-- =============================================
CREATE PROCEDURE [dbo].[GetTopStatements_AvgDuration]
	-- Add the parameters for the stored procedure here
	@NumOfStatements int = 25,
	@Executions int = 5
AS
BEGIN
	-- SET NOCOUNT ON added to prevent extra result sets from
	-- interfering with SELECT statements.
	SET NOCOUNT ON;

    -- Insert statements for procedure here
	--- top 25 statements by IO
IF OBJECT_ID('tempdb..#TopOffenders') IS NOT NULL
		DROP TABLE #TopOffenders
IF OBJECT_ID('tempdb..#QueryText') IS NOT NULL
		DROP TABLE #QueryText
CREATE TABLE #TopOffenders (AvgIO bigint, TotalIO bigint, TotalCPU bigint, AvgCPU bigint, TotalDuration bigint, AvgDuration bigint, [dbid] int, objectid bigint, execution_count bigint, query_hash varbinary(8))
CREATE TABLE #QueryText (query_hash varbinary(8), query_text varchar(max))

INSERT INTO #TopOffenders (AvgIO, TotalIO, TotalCPU, AvgCPU, TotalDuration, AvgDuration, [dbid], objectid, execution_count, query_hash)
SELECT TOP (@NumOfStatements)
        SUM((qs.total_logical_reads + qs.total_logical_writes) /qs.execution_count) as [Avg IO],
        SUM((qs.total_logical_reads + qs.total_logical_writes)) AS [TotalIO],
        SUM(qs.total_worker_time) AS Total_Worker_Time,
        SUM((qs.total_worker_time) / qs.execution_count) AS [AvgCPU],
        SUM(qs.total_elapsed_time) AS TotalDuration,
		SUM((qs.total_elapsed_time)/ qs.execution_count) AS AvgDuration,
    qt.dbid,
    qt.objectid,
    SUM(qs.execution_count) AS Execution_Count,
    qs.query_hash
FROM sys.dm_exec_query_stats qs
cross apply sys.dm_exec_sql_text (qs.sql_handle) as qt
GROUP BY qs.query_hash, qs.query_plan_hash, qt.dbid, qt.objectid
HAVING SUM(qs.execution_count) > @Executions
ORDER BY [AvgDuration] DESC

--select * From #TopOffenders
--ORDER BY TotalIO desc

/* Create cursor to get query text */
DECLARE @QueryHash varbinary(8)

DECLARE QueryCursor CURSOR FAST_FORWARD FOR
select query_hash
FROM #TopOffenders

OPEN QueryCursor
FETCH NEXT FROM QueryCursor INTO @QueryHash

WHILE (@@FETCH_STATUS = 0)
BEGIN

		INSERT INTO #QueryText (query_text, query_hash)
		select MIN(substring (qt.text,qs.statement_start_offset/2, 
				 (case when qs.statement_end_offset = -1 
				then len(convert(nvarchar(max), qt.text)) * 2 
				else qs.statement_end_offset end -    qs.statement_start_offset)/2)) 
				as query_text, qs.query_hash
		from sys.dm_exec_query_stats qs
		cross apply sys.dm_exec_sql_text (qs.sql_handle) as qt
		where qs.query_hash = @QueryHash
		GROUP BY qs.query_hash;

		FETCH NEXT FROM QueryCursor INTO @QueryHash
   END
   CLOSE QueryCursor
   DEALLOCATE QueryCursor

		select distinct DB_NAME(dbid) DBName, OBJECT_NAME(objectid, dbid) ObjectName, qt.query_text, o.*
		INTO #Results
		from #TopOffenders o
		join #QueryText qt on (o.query_hash = qt.query_hash)

		SELECT TOP (@NumOfStatements) *
		FROM #Results
		ORDER BY AvgDuration desc  

		DROP TABLE #Results
		DROP TABLE #TopOffenders
		DROP TABLE #QueryText
	END

GO

If you enjoyed this blog post please check out my related blog posts like  benchmarking your top waits and finding queries that cause your top waits or  what is running and benchmarking disk latency.

What Queries are Causing My Waits?

In my last blog post, I showed you how I go about baselining wait statistics. Typically my next step once I have found my top wait types is to use extended events to figure out the SQL statements causing the majority of the waits for those wait types. This is actually my favorite example of using extended events as it clearly shows you something that can be done that wasn’t possible with a SQL Server server side trace.

** Download Scripts Here **

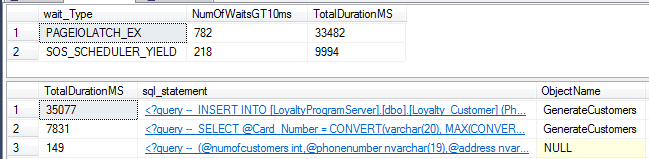
So, looking at the results of benchmarking my wait stats I noticed that my workload had several waits for SOS_SCHEDULER_YIELD and PAGEIOLATCH_EX. I could then run the following code below to figure out which statement(s) caused the majority of these waits as shown below and tune them to reduce my waits.
QueryCauseWaits

NOTE: Waits schema is required. It is created in the Baseline Wait Statistics sample code.

Capture Data with Extended Events

Regardless if you are using SQL 2008 or SQL Server 2012 the statement used create your extended event session to capture your SQL statements causing your top wait types is the same. In this extended event we will capture data into memory using 20 MB. This and the max_dispatch_latency can be configured with specifying the parameters into the stored procedure.

IF NOT EXISTS (SELECT 1 FROM sys.table_types where name like 'WaitType')
BEGIN
	CREATE TYPE WaitType AS TABLE 
	( Name VARCHAR(200))
END

/****** Object:  StoredProcedure [Waits].[CaptureStatementsCausingWaits]    Script Date: 10/7/2013 10:28:24 PM ******/
SET ANSI_NULLS ON
GO
SET QUOTED_IDENTIFIER ON
GO

-- =============================================
-- Author:		@JohnSterrett
-- Create date: 9/23/2013 
-- Description:	Gets SQL Statements causing top wait types.
-- 
-- =============================================
CREATE PROCEDURE [Waits].[CaptureStatementsCausingWaits] 
	-- Add the parameters for the stored procedure here
	@TVP WaitType READONLY, -- Table Value Parameter with Wait Types
	@Duration int = 10, 
	@StartXEvent bit = 1,
	@CreateXEvent bit = 1,
	@StopXevent bit = 0,
	@max_memory bigint = 20480,
	@max_dispatch_latency int =5

-- Sample Executions :

--**** What wait types are causing PAGEIOLATCH_EX, SOS_SCHEDULER_YIELD, 'PAGEIOLATCH_SH waits ****
/*
  DECLARE @WaitTypeTVP AS WaitType;
  INSERT INTO @WaitTypeTVP (Name)
  VALUES ('PAGEIOLATCH_EX'), ('SOS_SCHEDULER_YIELD'),('PAGEIOLATCH_SH')
  EXEC Waits.CaptureStatementsCausingWaits @TVP = @WaitTypeTVP;
  GO
*/

--*** Get wait details. XEvent is in memory so must still be running ****
--exec  [Waits].[GetStatementsCausingWaits]

--*** Stop Xevent from capturing (NOTE: Once this is done you will loose collected data) ***
--exec Waits.CaptureStatementsCausingWaits @StopXevent = 1

--/********* TODO: ***********************
--	Add checks for valid parameters
--	Verify that WaitTypes exist */
AS
BEGIN
	-- SET NOCOUNT ON added to prevent extra result sets from
	-- interfering with SELECT statements.
		SET NOCOUNT ON;
		IF @StopXevent = 1
		BEGIN
			IF EXISTS ( SELECT  *
						FROM    sys.server_event_sessions
						WHERE   name = 'TrackResourceWaits' ) 
					ALTER EVENT SESSION TrackResourceWaits ON SERVER STATE = STOP;
		END
		ELSE BEGIN
		-- Insert statements for procedure here
			DECLARE @SQLStmt nvarchar(max)

			IF OBJECT_ID('tempdb..##TmpWaitTypes') IS NOT NULL
				DROP TABLE ##TmpWaitTypes 

			SELECT map_key, map_value
			INTO ##TmpWaitTypes 
			FROM sys.dm_xe_map_values xmv
			JOIN @TVP tvp ON (tvp.name = xmv.map_value)
			WHERE xmv.name = 'wait_types'

			SELECT * FROM ##TmpWaitTypes 

			/* Step 3: Create XEvent to capture queries causing waits. Must update from step 2
			Use script to find top waits and then use this script to get statements causing those waits */
			IF @CreateXEvent = 1
			BEGIN
					DECLARE curWaitTypes CURSOR LOCAL FAST_FORWARD FOR
					SELECT map_key FROM ##TmpWaitTypes

					OPEN curWaitTypes
					DECLARE @map_key bigint, @SmallSQL nvarchar(max)
					SET @SmallSQL = ''

					FETCH NEXT FROM curWaitTypes
					INTO @map_key

					WHILE @@FETCH_STATUS = 0
					BEGIN
						SET @SmallSQL += 'wait_type = '+CAST(@map_key AS VARCHAR(50)) +' OR '

						FETCH NEXT FROM curWaitTypes
						INTO @map_key
					END
					CLOSE curWaitTypes;
					DEALLOCATE curWaitTypes;

					/* Remove the last comma */
					SET @SmallSQL = LEFT(@SmallSQL, LEN(@SmallSQL) - 3)
					PRINT @SmallSQL
					--AND (wait_type IN (50, 51, 124)
					IF EXISTS ( SELECT  *
								FROM    sys.server_event_sessions
								WHERE   name = 'TrackResourceWaits' ) 
						DROP EVENT SESSION TrackResourceWaits ON SERVER

					SET @SQLStmt = 'CREATE EVENT SESSION [TrackResourceWaits] ON SERVER 
					ADD EVENT  sqlos.wait_info
					(    -- Capture the database_id, session_id, plan_handle, and sql_text
						ACTION(sqlserver.database_id,sqlserver.username, sqlserver.session_id,sqlserver.sql_text,sqlserver.plan_handle, sqlserver.tsql_stack)
						WHERE
							(opcode = 1 --End Events Only
								AND duration > ' +CAST(@Duration AS VARCHAR(10)) +'
								AND (' +@SmallSQL+ ')

							)
					)
					ADD TARGET package0.ring_buffer(SET max_memory= '+CAST(@max_memory AS varchar(200))+')
					WITH (EVENT_RETENTION_MODE=ALLOW_SINGLE_EVENT_LOSS,
						  MAX_DISPATCH_LATENCY= '+CAST(@max_dispatch_latency as varchar(10))+' SECONDS)'

					PRINT @SQLStmt
					EXEC(@SQLStmt)

					/* Cleanup tasks */
					IF OBJECT_ID('tempdb..##TmpWaitTypes') IS NOT NULL
						DROP TABLE ##TmpWaitTypes 
				END

			IF @StartXEvent = 1
				ALTER EVENT SESSION TrackResourceWaits ON SERVER STATE = START;
			/* Step 4a: Start workload and wait */
		END
END

Reading Captured Data with SQL Server 2008

Now that we have our extended event running into memory we will need complete our analysis before we stop the extended event.  The following stored procedure can be used to pull the statements causing your top waits.

SET ANSI_NULLS ON
GO

SET QUOTED_IDENTIFIER ON
GO

-- =============================================
-- Author:		<Author,,Name>
-- Create date: <Create Date,,>
-- Description:	<Description,,>
-- =============================================
CREATE PROCEDURE [Waits].[GetStatementsCausingWaits_2008]
	-- Add the parameters for the stored procedure here
AS
BEGIN
	-- SET NOCOUNT ON added to prevent extra result sets from
	-- interfering with SELECT statements.
	SET NOCOUNT ON;

    -- Insert statements for procedure here
			/* Step 4b: Query the waits */
		IF OBJECT_ID('tempdb..#XWaits') IS NOT NULL
			DROP TABLE #XWaits

		SELECT 
			event_data.value('(event/@name)[1]', 'varchar(50)') AS event_name,
			DATEADD(hh, 
				DATEDIFF(hh, GETUTCDATE(), CURRENT_TIMESTAMP), 
				event_data.value('(event/@timestamp)[1]', 'datetime2')) AS [timestamp],
			COALESCE(event_data.value('(event/data[@name="database_id"]/value)[1]', 'int'), 
				event_data.value('(event/action[@name="database_id"]/value)[1]', 'int')) AS database_id,
			event_data.value('(event/action[@name="session_id"]/value)[1]', 'int') AS [session_id],
			event_data.value('(event/data[@name="wait_type"]/text)[1]', 'nvarchar(4000)') AS [wait_type],
			event_data.value('(event/data[@name="opcode"]/text)[1]', 'nvarchar(4000)') AS [opcode],
			event_data.value('(event/data[@name="duration"]/value)[1]', 'bigint') AS [duration],
			event_data.value('(event/data[@name="max_duration"]/value)[1]', 'bigint') AS [max_duration],
			event_data.value('(event/data[@name="total_duration"]/value)[1]', 'bigint') AS [total_duration],
			event_data.value('(event/data[@name="signal_duration"]/value)[1]', 'bigint') AS [signal_duration],
			event_data.value('(event/data[@name="completed_count"]/value)[1]', 'bigint') AS [completed_count],
			event_data.value('(event/action[@name="plan_handle"]/value)[1]', 'nvarchar(4000)') AS [plan_handle],
			event_data.value('(event/action[@name="sql_text"]/value)[1]', 'nvarchar(4000)') AS [sql_text],
			event_data.value('(event/action[@name="tsql_stack"]/value)[1]', 'nvarchar(4000)') AS [tsql_stack]
			INTO #XWaits
		FROM 
		(    SELECT XEvent.query('.') AS event_data 
			FROM 
			(    -- Cast the target_data to XML 
				SELECT CAST(target_data AS XML) AS TargetData 
				FROM sys.dm_xe_session_targets st 
				JOIN sys.dm_xe_sessions s 
					ON s.address = st.event_session_address 
				WHERE name = 'TrackResourceWaits' 
					AND target_name = 'ring_buffer'
			) AS Data 
			-- Split out the Event Nodes 
			CROSS APPLY TargetData.nodes ('RingBufferTarget/event') AS XEventData (XEvent)   
		) AS tab (event_data)

		-- Need to get tsql_stack as XML to manipulate --
		ALTER TABLE #XWaits ADD tsql_stack2 XML
		UPDATE #XWaits SET tsql_stack2 = '<Root>' + tsql_stack + '</Root>'

		-- Duration by Wait
		SELECT wait_Type, COUNT(*) AS NumOfWaitsGT10ms, SUM(duration) AS TotalDurationMS
		FROM #XWaits
		GROUP BY wait_type
		ORDER BY TotalDurationMS DESC

		-- Get wait's for block of t-sql code

		IF OBJECT_ID('tempdb..#TempData') IS NOT NULL
			DROP TABLE #TempData;

		WITH XWaitsCTE (database_id, session_id, wait_type, duration, plan_handle, tsql_stack, handle, offsetStart, offsetEnd)
		AS
		(
		SELECT database_id, session_id, wait_type, duration, plan_handle, tsql_stack --,tsql_stack2
			,tsql_stack2.value('(Root/frame/@handle)[1]', 'varchar(2000)') as handle
			--,CONVERT(tsql_stack2.value('(Root/frame/@handle)[1]', 'nvarchar(2000)') as handle2
			,tsql_stack2.value('(Root/frame/@offsetStart)[1]', 'varchar(4000)') as offsetStart
			,tsql_stack2.value('(Root/frame/@offsetEnd)[1]', 'varchar(4000)') as offsetEnd
		FROM	#XWaits 
		)
		SELECT 	wait_type, COUNT(*) AS NumOfWaitsGT10ms, SUM(duration) AS TotalDurationMS, handle, offsetStart, offsetEnd, database_id
		INTO #TempData
		FROM XWaitsCTE
		GROUP BY wait_type, handle, offsetStart, offsetEnd, database_id;

		--SELECT *, DB_NAME(database_id) 
		--FROM #TempData 
		--ORDER BY TotalDurationMS DESC;

		/* Top statements causing wait types 
		SELECT TOP 20 SUM(TotalDurationMS) TotalDurationMS, handle,  offsetStart, offsetEnd, DB_NAME(database_id) 
		FROM #TempData
		GROUP BY handle, offsetEnd, offsetStart, database_id
		ORDER BY 1 desc; */

		/* Look at statement causing wait times 
			Substitue handle, offsetStart and offsetEnd from query above 
		*/

		/*** Get statement causing waits ****/
		IF OBJECT_ID('tempdb..#SQLStatement') IS NOT NULL
			DROP TABLE #SQLStatement;

		CREATE TABLE #SQLStatement (handleText varchar(4000), offsetStart varchar(1000), offsetEnd varchar(1000), 
					sql_statement xml, ObjectName varchar(2000), objectid bigint, databaseid int, encrypted bit) 

		DECLARE WaitStatement CURSOR LOCAL FAST_FORWARD FOR
		SELECT TOP 20 SUM(TotalDurationMS) AS TotalDurationMS, handle,  offsetStart, offsetEnd, DB_NAME(database_id) 
		FROM #TempData
		GROUP BY handle, offsetEnd, offsetStart, database_id
		ORDER BY 1 desc;

		OPEN WaitStatement 
		DECLARE @TotalDurationMS bigint, @handle varchar(2000), @offsetStart varchar(100), @offsetEnd varchar(100), @databaseName varchar(4000), @SQLStmt nvarchar(max)

		FETCH NEXT FROM WaitStatement
		INTO @TotalDurationMS, @handle, @offsetStart, @offsetEnd, @databaseName

		WHILE @@FETCH_STATUS = 0
		BEGIN
			SET @SQLStmt = 'USE [' + @databaseName+'] '+CHAR(10)

			SET @SQLStmt = @SQLStmt + ' declare @offsetStart bigint, @offsetEnd bigint, @handle varbinary(64), @handleText varchar(4000) '
			SET @SQLStmt = @SQLStmt + ' select @offsetStart = '+@offsetStart +', @offsetEnd = '+case when @offsetEnd like '-1' then '2147483647' else @offsetEnd end+', @handle = '+@handle+', @handleText = '''+@handle+''''

			SET @SQLStmt = @SQLStmt + CHAR(10)+ ' INSERT INTO #SQLStatement (sql_statement, ObjectName, objectid, databaseid, encrypted, offsetStart, offsetEnd, handleText) '
			SET @SQLStmt = @SQLStmt + CHAR(10)+ ' select CAST(''<?query --''+CHAR(13)+SUBSTRING(qt.text, (@offsetStart/ 2)+1, 
			(( @offsetEnd - @offsetStart)/2) + 1)+CHAR(13)+''--?>'' AS xml) as sql_statement '
			SET @SQLStmt = @SQLStmt + CHAR(10)+ ' , OBJECT_NAME(qt.objectid) OBJNAME
			,qt.objectid,qt.dbid, qt.encrypted, @offsetStart as offsetStart, @offsetEnd as offsetEnd, @handleText as handleText '
			SET @SQLStmt = @SQLStmt + CHAR(10)+ '     from sys.dm_exec_sql_text(@handle) qt '

			--PRINT @SQLStmt
			EXEC (@SQLStmt)

			FETCH NEXT FROM WaitStatement
			INTO @TotalDurationMS, @handle, @offsetStart, @offsetEnd, @databaseName
		END
		CLOSE WaitStatement;
		DEALLOCATE WaitStatement;

		/*** GET THE SQL GOOD STUFF *******************************************/

		WITH cte_SQLStatement (TotalDurationMS, handle, offsetStart, offsetEnd, databaseName)
		AS
		(	
			SELECT TOP 20 SUM(TotalDurationMS) TotalDurationMS, handle,  offsetStart, offsetEnd, DB_NAME(database_id) 
			FROM #TempData
			GROUP BY handle, offsetEnd, offsetStart, database_id
			ORDER BY 1 desc
		)
		SELECT TotalDurationMS, ts.sql_statement, ts.ObjectName, td.handle,  td.offsetStart, td.offsetEnd, td.databaseName 
		FROM cte_SQLStatement td
		LEFT JOIN #SQLStatement ts ON (td.handle = ts.handleText AND td.offsetStart = ts.offsetStart)
		ORDER BY TotalDurationMS desc;
END

GO

Reading Captured Data with SQL Server 2012

The following is a similar stored procedure customized to work with SQL Server 2012.

SET ANSI_NULLS ON
GO

SET QUOTED_IDENTIFIER ON
GO

-- =============================================
-- Author:		<Author,,Name>
-- Create date: <Create Date,,>
-- Description:	<Description,,>
-- =============================================
CREATE PROCEDURE [Waits].[GetStatementsCausingWaits_2012]
	-- Add the parameters for the stored procedure here
AS
BEGIN
	-- SET NOCOUNT ON added to prevent extra result sets from
	-- interfering with SELECT statements.
	SET NOCOUNT ON;

    -- Insert statements for procedure here
			/* Step 4b: Query the waits */
		IF OBJECT_ID('tempdb..#XWaits') IS NOT NULL
			DROP TABLE #XWaits

		SELECT 
			event_data.value('(event/@name)[1]', 'varchar(50)') AS event_name,
			DATEADD(hh, 
				DATEDIFF(hh, GETUTCDATE(), CURRENT_TIMESTAMP), 
				event_data.value('(event/@timestamp)[1]', 'datetime2')) AS [timestamp],
			COALESCE(event_data.value('(event/data[@name="database_id"]/value)[1]', 'int'), 
				event_data.value('(event/action[@name="database_id"]/value)[1]', 'int')) AS database_id,
			event_data.value('(event/action[@name="session_id"]/value)[1]', 'int') AS [session_id],
			event_data.value('(event/data[@name="wait_type"]/text)[1]', 'nvarchar(4000)') AS [wait_type],
			event_data.value('(event/data[@name="opcode"]/text)[1]', 'nvarchar(4000)') AS [opcode],
			event_data.value('(event/data[@name="duration"]/value)[1]', 'bigint') AS [duration],
			event_data.value('(event/data[@name="max_duration"]/value)[1]', 'bigint') AS [max_duration],
			event_data.value('(event/data[@name="total_duration"]/value)[1]', 'bigint') AS [total_duration],
			event_data.value('(event/data[@name="signal_duration"]/value)[1]', 'bigint') AS [signal_duration],
			event_data.value('(event/data[@name="completed_count"]/value)[1]', 'bigint') AS [completed_count],
			event_data.value('(event/action[@name="plan_handle"]/value)[1]', 'nvarchar(4000)') AS [plan_handle],
			event_data.query('(event/action[@name="tsql_stack"]/value)[1]') AS tsql_stack,
			event_data.query('(event/action[@name="tsql_frame"]/value)[1]') AS tsql_frame
			INTO #XWaits
		FROM 
		(    SELECT XEvent.query('.') AS event_data 
			FROM 
			(    -- Cast the target_data to XML 
				SELECT CAST(target_data AS XML) AS TargetData 
				FROM sys.dm_xe_session_targets st 
				JOIN sys.dm_xe_sessions s 
					ON s.address = st.event_session_address 
				WHERE name = 'TrackResourceWaits' 
					AND target_name = 'ring_buffer'
			) AS Data 
			-- Split out the Event Nodes 
			CROSS APPLY TargetData.nodes ('RingBufferTarget/event') AS XEventData (XEvent)   
		) AS tab (event_data)

		-- Need to get tsql_stack as XML to manipulate --
		/**** Required for SQL 2008 ****
		ALTER TABLE #XWaits ADD tsql_stack2 XML
		UPDATE #XWaits SET tsql_stack2 = '<Root>' + tsql_stack + '</Root>' */

		-- Duration by Wait
		SELECT wait_Type, COUNT(*) AS NumOfWaitsGT10ms, SUM(duration) AS TotalDurationMS
		FROM #XWaits
		GROUP BY wait_type
		ORDER BY TotalDurationMS DESC

		-- Get wait's for block of t-sql code

		IF OBJECT_ID('tempdb..#TempData') IS NOT NULL
			DROP TABLE #TempData;

		WITH XWaitsCTE (database_id, session_id, wait_type, duration, plan_handle, tsql_stack, handle, offsetStart, offsetEnd)
		AS
		(
		SELECT database_id, session_id, wait_type, duration, plan_handle, tsql_stack --,tsql_stack2
			,pref.value('(/value/frames/frame/@handle)[1]', 'varchar(2000)') as handle
			,pref.value('(/value/frames/frame/@offsetStart)[1]', 'varchar(4000)') as offsetStart
			,pref.value('(/value/frames/frame/@offsetEnd)[1]', 'varchar(200)') as offsetEnd
	--,SQLTEXT.text
		FROM	#XWaits CROSS APPLY 
				tsql_stack.nodes('/value/frames') AS People(pref)
		)
		SELECT 	wait_type, COUNT(*) AS NumOfWaitsGT10ms, SUM(duration) AS TotalDurationMS, handle, offsetStart, offsetEnd, database_id
		INTO #TempData
		FROM XWaitsCTE
		GROUP BY wait_type, handle, offsetStart, offsetEnd, database_id;

		--SELECT *, DB_NAME(database_id) 
		--FROM #TempData 
		--ORDER BY TotalDurationMS DESC;

		/* Top statements causing wait types 
		SELECT TOP 20 SUM(TotalDurationMS) TotalDurationMS, handle,  offsetStart, offsetEnd, DB_NAME(database_id) 
		FROM #TempData
		GROUP BY handle, offsetEnd, offsetStart, database_id
		ORDER BY 1 desc; */

		/* Look at statement causing wait times 
			Substitue handle, offsetStart and offsetEnd from query above 
		*/

		/*** Get statement causing waits ****/
		IF OBJECT_ID('tempdb..#SQLStatement') IS NOT NULL
			DROP TABLE #SQLStatement;

		CREATE TABLE #SQLStatement (handleText varchar(4000), offsetStart varchar(1000), offsetEnd varchar(1000), 
					sql_statement xml, ObjectName varchar(2000), objectid bigint, databaseid int, encrypted bit) 

		DECLARE WaitStatement CURSOR LOCAL FAST_FORWARD FOR
		SELECT TOP 20 SUM(TotalDurationMS) AS TotalDurationMS, handle,  offsetStart, offsetEnd, DB_NAME(database_id) 
		FROM #TempData
		GROUP BY handle, offsetEnd, offsetStart, database_id
		ORDER BY 1 desc;

		OPEN WaitStatement 
		DECLARE @TotalDurationMS bigint, @handle varchar(2000), @offsetStart varchar(100), @offsetEnd varchar(100), @databaseName varchar(4000), @SQLStmt nvarchar(max)

		FETCH NEXT FROM WaitStatement
		INTO @TotalDurationMS, @handle, @offsetStart, @offsetEnd, @databaseName

		WHILE @@FETCH_STATUS = 0
		BEGIN
			SET @SQLStmt = 'USE [' + @databaseName+'] '+CHAR(10)

			SET @SQLStmt = @SQLStmt + ' declare @offsetStart bigint, @offsetEnd bigint, @handle varbinary(64), @handleText varchar(4000) '
			SET @SQLStmt = @SQLStmt + ' select @offsetStart = '+@offsetStart +', @offsetEnd = '+case when @offsetEnd like '-1' then '2147483647' else @offsetEnd end+', @handle = '+@handle+', @handleText = '''+@handle+''''

			SET @SQLStmt = @SQLStmt + CHAR(10)+ ' INSERT INTO #SQLStatement (sql_statement, ObjectName, objectid, databaseid, encrypted, offsetStart, offsetEnd, handleText) '
			SET @SQLStmt = @SQLStmt + CHAR(10)+ ' select CAST(''<?query --''+CHAR(13)+SUBSTRING(qt.text, (@offsetStart/ 2)+1, 
			(( @offsetEnd - @offsetStart)/2) + 1)+CHAR(13)+''--?>'' AS xml) as sql_statement '
			SET @SQLStmt = @SQLStmt + CHAR(10)+ ' , OBJECT_NAME(qt.objectid) OBJNAME
			,qt.objectid,qt.dbid, qt.encrypted, @offsetStart as offsetStart, @offsetEnd as offsetEnd, @handleText as handleText '
			SET @SQLStmt = @SQLStmt + CHAR(10)+ '     from sys.dm_exec_sql_text(@handle) qt '

			--PRINT @SQLStmt
			EXEC (@SQLStmt)

			FETCH NEXT FROM WaitStatement
			INTO @TotalDurationMS, @handle, @offsetStart, @offsetEnd, @databaseName
		END
		CLOSE WaitStatement;
		DEALLOCATE WaitStatement;

		/*** GET THE SQL GOOD STUFF *******************************************/

		WITH cte_SQLStatement (TotalDurationMS, handle, offsetStart, offsetEnd, databaseName)
		AS
		(	
			SELECT TOP 20 SUM(TotalDurationMS) TotalDurationMS, handle,  offsetStart, offsetEnd, DB_NAME(database_id) 
			FROM #TempData
			GROUP BY handle, offsetEnd, offsetStart, database_id
			ORDER BY 1 desc
		)
		SELECT TotalDurationMS, ts.sql_statement, ts.ObjectName, td.handle,  td.offsetStart, td.offsetEnd, td.databaseName 
		FROM cte_SQLStatement td
		LEFT JOIN #SQLStatement ts ON (td.handle = ts.handleText AND td.offsetStart = ts.offsetStart)
		ORDER BY TotalDurationMS desc;
END

Making Get Statements Causing Waits Easy

The following stored procedure makes getting our statements easy. It basically does a quick check to see if your using SQL 2012 or SQL 2008 and executes the correct stored procedure.

SET ANSI_NULLS ON
GO

SET QUOTED_IDENTIFIER ON
GO

-- =============================================
-- Author:		<Author,,Name>
-- Create date: <Create Date,,>
-- Description:	<Description,,>
-- =============================================
CREATE PROCEDURE [Waits].[GetStatementsCausingWaits]
	-- Add the parameters for the stored procedure here
AS
BEGIN
	-- SET NOCOUNT ON added to prevent extra result sets from
	-- interfering with SELECT statements.
	SET NOCOUNT ON;

	DECLARE @VersionNumber VARCHAR(100), @VersionInt INT
	SELECT @VersionNumber = CAST(SERVERPROPERTY(N'productversion') AS VARCHAR(100))
	SELECT @VersionInt = CAST(SUBSTRING(@VersionNumber, 1, CHARINDEX('.', @VersionNumber)-1) AS INT)

	IF @VersionInt = 11 
	BEGIN 
		EXEC Waits.GetStatementsCausingWaits_2012
	END
	ELSE IF @VersionInt = 10
	BEGIN
		EXEC Waits.GetStatementsCausingWaits_2008
	END --end ifs
END -- end proc
GO

Execution Example

  1.  Benchmark Wait Types to find the top wait types for your workload
  2. Start Extended Event Capture for your workload top wait types
    DECLARE @WaitTypeTVP AS WaitType;
      INSERT INTO @WaitTypeTVP (Name)
      VALUES ('PAGEIOLATCH_EX'), ('SOS_SCHEDULER_YIELD'),('PAGEIOLATCH_SH')
      EXEC Waits.CaptureStatementsCausingWaits @TVP = @WaitTypeTVP;
  3. Get Statements Causing Waits
    exec  [Waits].[GetStatementsCausingWaits]
  4. Stop Extended Event Capture
    exec Waits.CaptureStatementsCausingWaits @StopXevent = 1